题目
MUF0121 Physics Unit 1 - Semester 2, 2025 2.10 Graphical analysis of motion
数值题
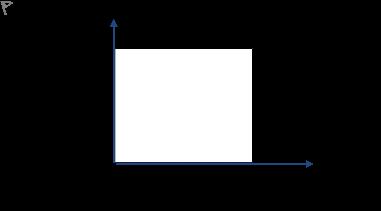
The graph shows the speed of a can travelling along a conveyor belt in a factory. The can's displacement (in metres) can be calculated from the area under this graph. What is it?
查看解析
标准答案
Please login to view
思路分析
When a velocity–time graph is integrated, the area under the curve represents displacement. In this graph, the can’s velocity is constant over a certain......Login to view full explanation登录即可查看完整答案
我们收录了全球超50000道考试原题与详细解析,现在登录,立即获得答案。
类似问题
The speed-time graphs for three vehicles X, Y, and Z are shown. If x, y, and z are the distance travelled by X, Y, and Z respectively in 8 s, which of the following comparison is correct?
What is the unit used to measure the quantity represented by the area under this graph?
The graph shows the speed of a remote controlled toy speed boat on a river. It speeds up for six seconds and then slows down for the same amount of time. The boat's displacement (in metres) can be calculated from the area under this graph. What is it?
The graph shows the speed of a remote controlled toy car on a pathway. It speeds up for one and a half seconds and then slows down for the same amount of time. The car's displacement (in metres) can be calculated from the area under this graph. What is it? Give your answer to 3 significant figures.
更多留学生实用工具
希望你的学习变得更简单
加入我们,立即解锁 海量真题 与 独家解析,让复习快人一步!