题目
数值题
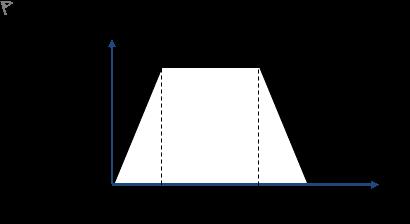
The graph shows the speed of a remote controlled toy car travelling along a race track. The car's displacement (in metres) can be calculated from the area under this graph. What is it? Give your answer to 3 significant figures.
查看解析
标准答案
Please login to view
思路分析
The displacement is given by the area beneath the velocity–time graph. To compute it, break the graph into simple shapes whose areas you can calculate directly, then sum them.
First, identify the distinct regions under the curve. In this graph there are three regions:
- A left triangular ramp where velocity increases from 0 to some maximum value at the end of the first segment.
- A middle rectangular (constant velocity) region where veloci......Login to view full explanation登录即可查看完整答案
我们收录了全球超50000道考试原题与详细解析,现在登录,立即获得答案。
类似问题
The figure shows the v-t graph of a truck moving on the road. The distance travelled in the first 8 seconds is
The graph shows the speed of a car travelling along a road during heavy traffic. The car's displacement (in metres) can be calculated from the area under this graph. What is it? Give your answer to one significant figure.
A toy car accelerated from rest for 2.8 seconds, then continued at its maximum speed of 1.8 m s-1 until 8.2 seconds, then put on its brakes and decelerated to a stop in 12.5 seconds. Its motion is plotted on the graph below. How far did it travel when it accelerated (\( t_1 \))? Give your answer to two decimal places.
A toy car accelerated from rest for 2.8 seconds, then continued at its maximum speed of 1.8 m s-1 until 8.2 seconds, then put on its brakes and decelerated to a stop in 12.5 seconds. Its motion is plotted on the graph below. How far did it travel when it accelerated (\( t_1 \))? Give your answer to two decimal places.
更多留学生实用工具
希望你的学习变得更简单
加入我们,立即解锁 海量真题 与 独家解析,让复习快人一步!