题目
SPHY001 Graded Quiz 1 (Unit 1 and Unit 2)- Requires Respondus LockDown Browser
单项选择题
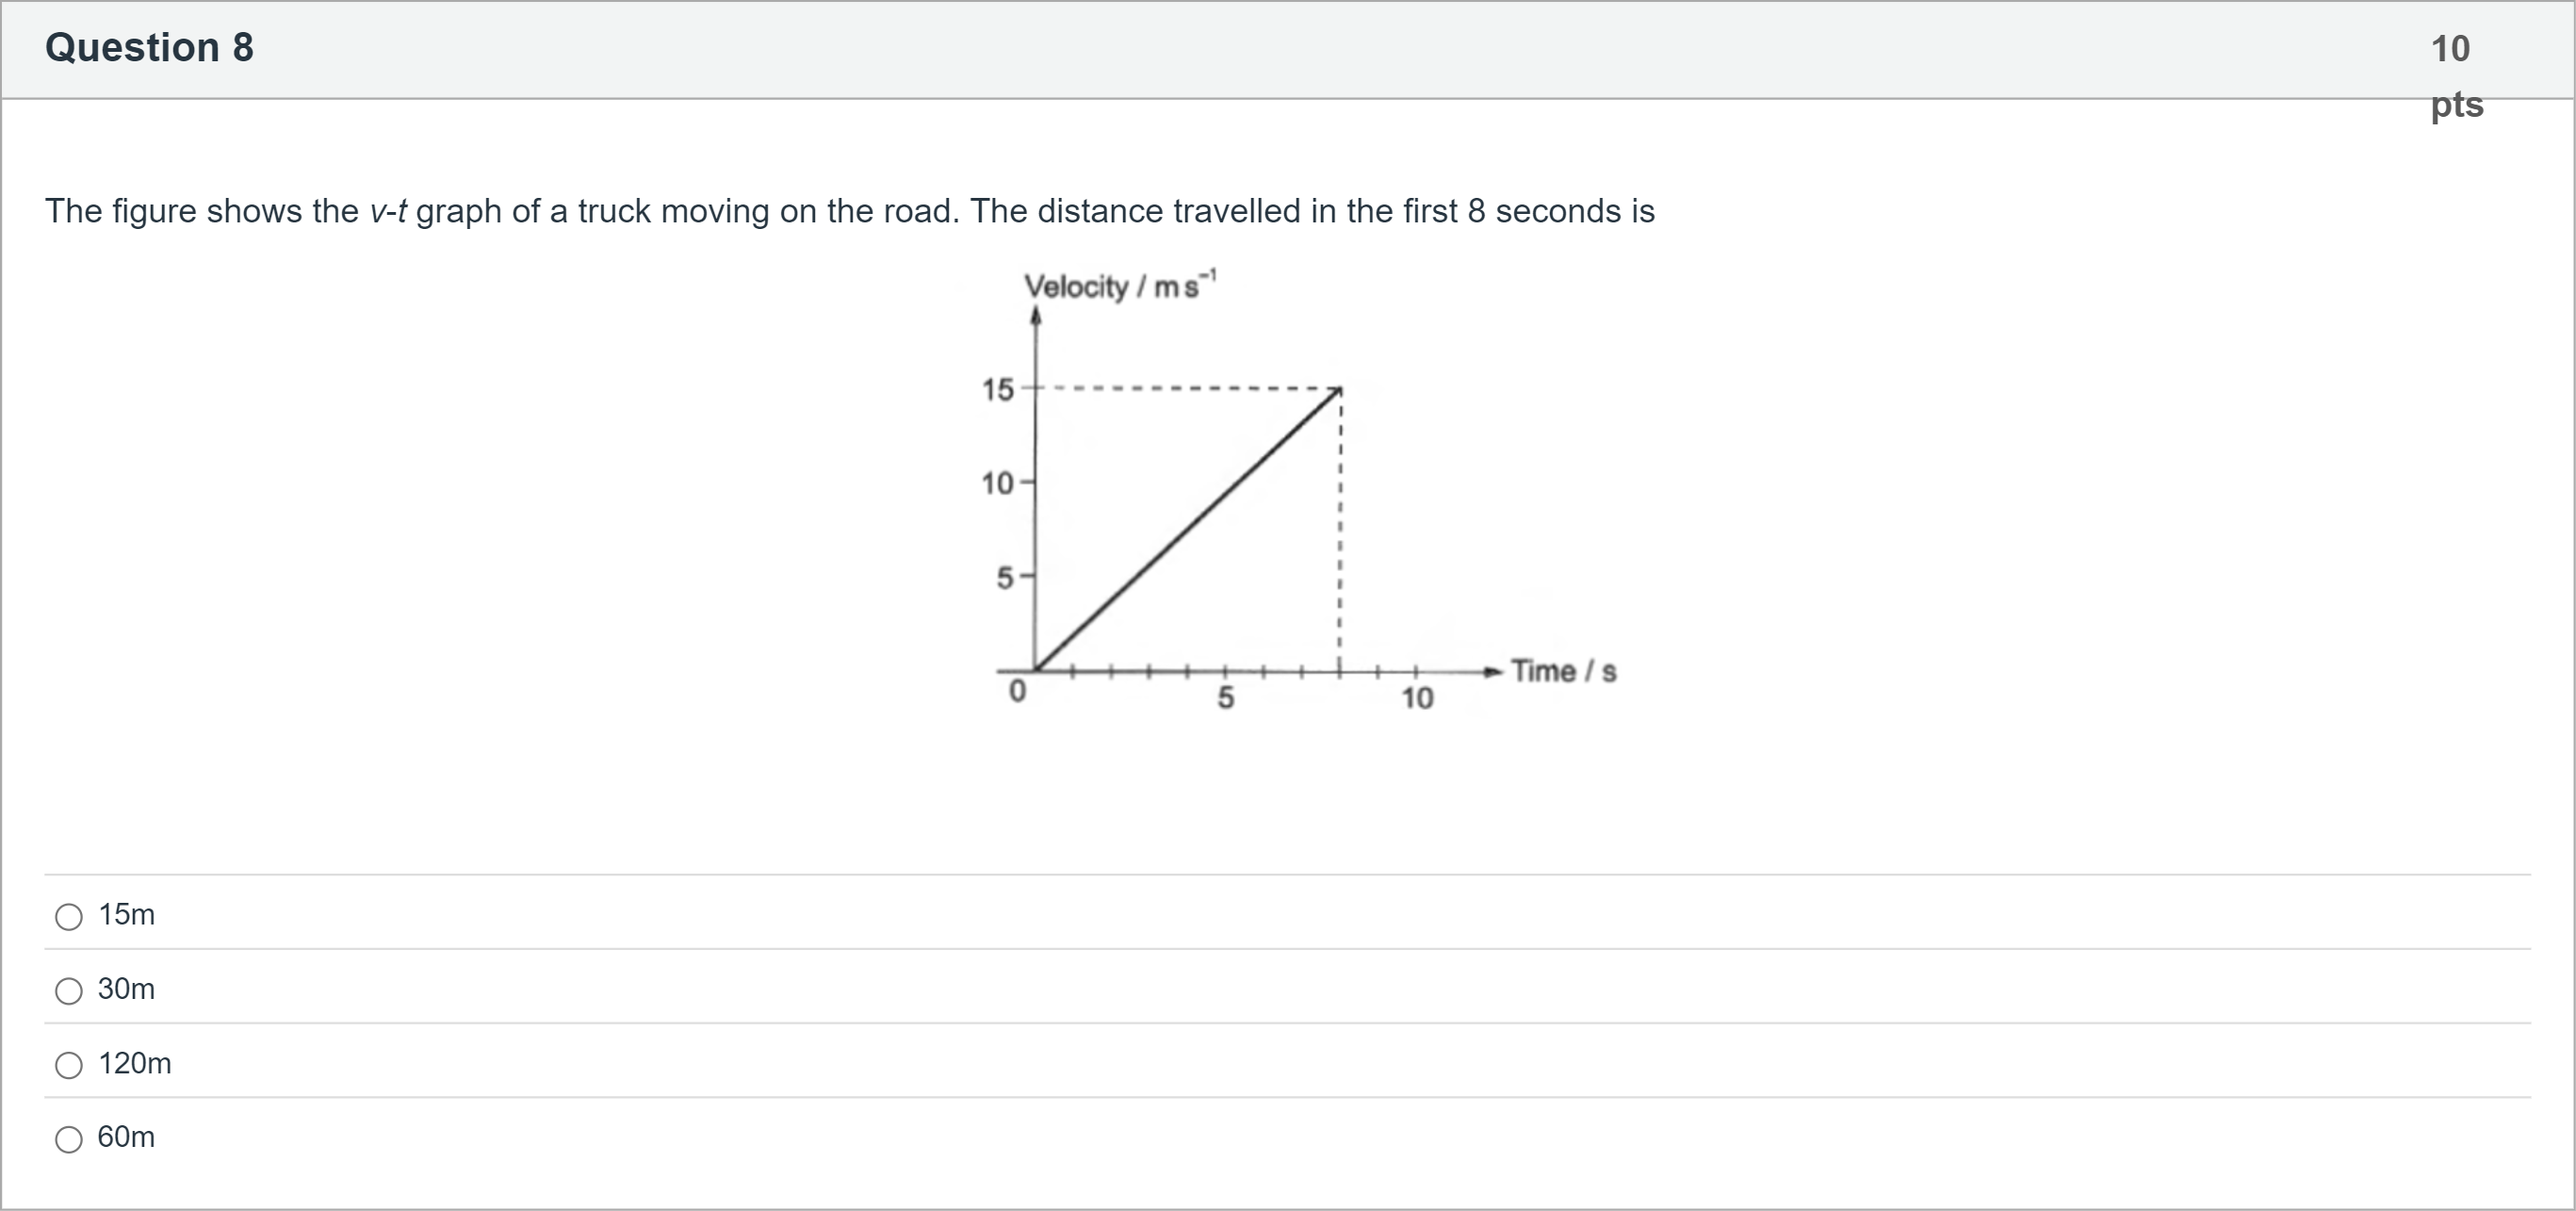
The figure shows the v-t graph of a truck moving on the road. The distance travelled in the first 8 seconds is
选项
A.15m
B.30m
C.120m
D.60m
查看解析
标准答案
Please login to view
思路分析
The question asks for the distance travelled in the first 8 seconds, which is the area under the velocity-time (v-t) graph from t = 0 to t = 8 s.
Option 1 (15 m): This would correspond to a much smaller area, since the velocity is zero at t = 0 and increases linearly, so the area up to 8 s cannot be as low as 15 m.
Option 2 (30 m): Though clo......Login to view full explanation登录即可查看完整答案
我们收录了全球超50000道考试原题与详细解析,现在登录,立即获得答案。
类似问题
The graph shows the speed of a car travelling along a road during heavy traffic. The car's displacement (in metres) can be calculated from the area under this graph. What is it? Give your answer to one significant figure.
The graph shows the speed of a remote controlled toy car travelling along a race track. The car's displacement (in metres) can be calculated from the area under this graph. What is it? Give your answer to 3 significant figures.
A toy car accelerated from rest for 2.8 seconds, then continued at its maximum speed of 1.8 m s-1 until 8.2 seconds, then put on its brakes and decelerated to a stop in 12.5 seconds. Its motion is plotted on the graph below. How far did it travel when it accelerated (\( t_1 \))? Give your answer to two decimal places.
A toy car accelerated from rest for 2.8 seconds, then continued at its maximum speed of 1.8 m s-1 until 8.2 seconds, then put on its brakes and decelerated to a stop in 12.5 seconds. Its motion is plotted on the graph below. How far did it travel when it accelerated (\( t_1 \))? Give your answer to two decimal places.
更多留学生实用工具
希望你的学习变得更简单
加入我们,立即解锁 海量真题 与 独家解析,让复习快人一步!