你还在为考试焦头烂额?找我们就对了!
我们知道现在是考试月,你正在为了考试复习到焦头烂额。为了让更多留学生在备考与学习季更轻松,我们决定将Gold会员限时免费开放至2025年12月31日!原价£29.99每月,如今登录即享!无门槛领取。
助你高效冲刺备考!
题目
Dashboard Week 1 Quiz
单项选择题
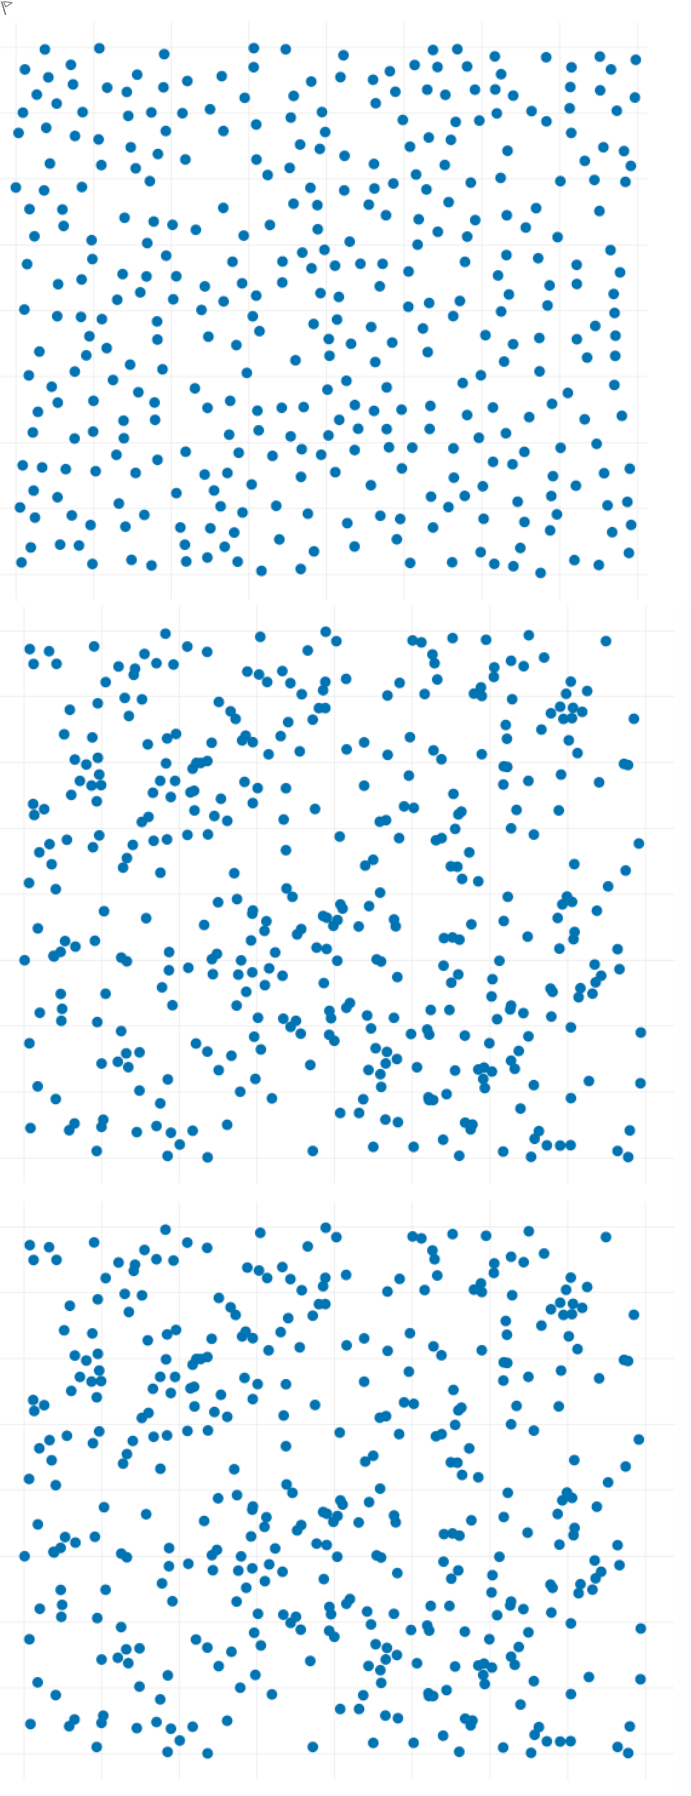
Which one of these images shows data generated uniformly at random?
查看解析
标准答案
Please login to view
思路分析
The question asks which image shows data generated uniformly at random, and the provided data includes only the chosen answer 'b.' with no explicit text for the answer options. Because the actual option texts are missing, I will outline how you would evaluate the images if you had the full options, and then apply that to the likely candidate.
Understanding uniform random data: Uniform randomness in two dimensions means the points are spread evenly across the ent......Login to view full explanation登录即可查看完整答案
我们收录了全球超50000道考试原题与详细解析,现在登录,立即获得答案。
类似问题
Question at position 1 The shape of the uniform probability distribution is:positively skewed.negatively skewed.bell-shaped.rectangular
It is hypothesized that a population has a uniform distribution between 0 and 10.2. A goodness of fit will be performed to decide if this hypothesis is correct. To perform this test, each observed data value X will need to be categorized. It is decided that the categories should be as follows: Category 1 2 3 4 5 x=observation 0 <= X <= 2 2 < X <= 4.1 4.1 < X <= 6 6 < X <= 7.9 7.9 < X <=10.2 If this hypothesis is correct, what proportion of observations should be in Category 3?
The assembly time for a product is uniformly distributed between 6 to 10 minutes. The probability of assembling the product in less than 6 minutes is
The height of the probability density function f(x) of a random variable X that is uniformly distributed between a and b is:
更多留学生实用工具
希望你的学习变得更简单
为了让更多留学生在备考与学习季更轻松,我们决定将Gold 会员限时免费开放至2025年12月31日!