题目
单项选择题
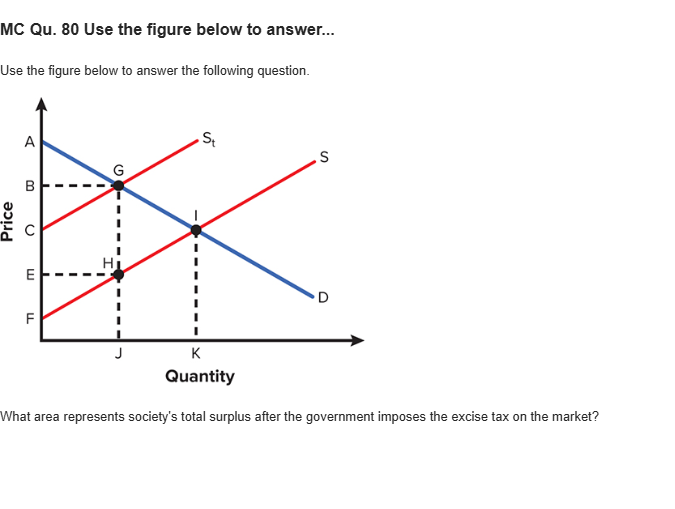
MC Qu. 80 Use the figure below to answer... Use the figure below to answer the following question. The horizontal axis is labeled quantity and the vertical axis is labeled price. The two supply curves, S sub t and S starts from different points on the vertical axis and rises parallel to each other. Curve S starts from point F on the lower section of the vertical axis. It then rises through point H (J, E). Curve S sub t starts from point C on the middle section of the vertical axis. It then rises through point G (J, B). The demand curve D falls from point A on the top section of the vertical axis. It intersects s sub t at point G (J, B) and S at point I (K, C). What area represents society's total surplus after the government imposes the excise tax on the market?
选项
A.triangle FHE plus triangle BGA
B.triangle GHI
C.rectangle EHBG plus triangle BGA
D.triangle FHE plus triangle BGA plus rectangle EHGB
查看解析
标准答案
Please login to view
思路分析
To analyze the total surplus after the excise tax, we must identify which geometric areas on the labeled supply and demand diagram represent the sum of consumer and producer surplus that remains for society.
Option 1: triangle FHE plus triangle BGA. This pairing corresponds to the portions of the welfare diagram that remain as the post-tax equilibrium areas for consumer and producer surplus, capturing the retained gains from trade after the tax we......Login to view full explanation登录即可查看完整答案
我们收录了全球超50000道考试原题与详细解析,现在登录,立即获得答案。
类似问题
Question at position 6 What are the values of total surplus before and after tax imposition?(TS0=10.5,TS1=6)\left(TS^0=10.5,TS^1=6\right)(TS0=12.5,TS1=10)\left(TS^0=12.5,TS^1=10\right)(TS0=13.5,TS1=12)\left(TS^0=13.5,TS^1=12\right)(TS0=15,TS1=10.5)\left(TS^0=15,TS^1=10.5\right)
Table 7-11[table] Price(Dollars per unit) | Quantity Demanded(Units) | Quantity Supplied(Units) 12.00 | 0 | 36 10.00 | 3 | 30 8.00 | 6 | 24 6.00 | 9 | 18 4.00 | 12 | 12 2.00 | 15 | 6 0.00 | 18 | 0 [/table]Refer to Table 7-11. Both the demand curve and the supply curve are straight lines. At equilibrium, total surplus is
Table 7-11[table] Price(Dollars per unit) | Quantity Demanded(Units) | Quantity Supplied(Units) 12.00 | 0 | 36 10.00 | 3 | 30 8.00 | 6 | 24 6.00 | 9 | 18 4.00 | 12 | 12 2.00 | 15 | 6 0.00 | 18 | 0 [/table]Refer to Table 7-11. At a price of $2.00, total surplus is
Moving production from a high-cost producer to a low-cost producer will
更多留学生实用工具
希望你的学习变得更简单
加入我们,立即解锁 海量真题 与 独家解析,让复习快人一步!