题目
单项选择题
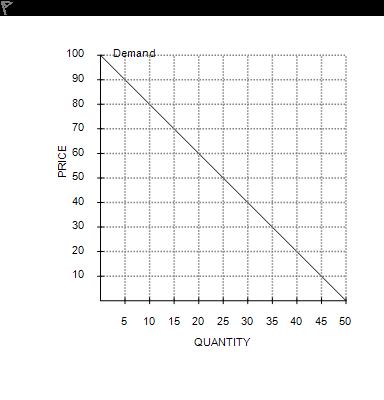
Figure 5-7Refer to Figure 5-7. If, holding the supply curve fixed, there were an increase in demand that caused the equilibrium price to increase from $6 to $7, then sellers' total revenue would
查看解析
标准答案
Please login to view
思路分析
To analyze this question, we start by noting the setup: the supply curve is fixed, and there is a rightward shift in demand causing the equilibrium price to rise from $6 to $7. The graph shows a downward-sloping demand line, with price on the vertical axis and quantity on the horizontal axis. With a fixed supply, the equilibrium quantity is determined where the fixed supply intersects the new demand curve; as demand increases, this intersection occurs at a hi......Login to view full explanation登录即可查看完整答案
我们收录了全球超50000道考试原题与详细解析,现在登录,立即获得答案。
类似问题
Table 14-4 The following table presents cost and revenue information for a firm operating in a competitive industry. Costs Revenues Quantity Supplied (Units) Total Cost (Dollars) Marginal Cost (Dollars) Quantity Demanded (Units) Price (Dollars per unit) Total Revenue (Dollars) Marginal Revenue (Dollars) 0 100 -- 0 120 -- 1 150 1 120 2 202 2 120 3 257 3 120 4 317 4 120 5 385 5 120 6 465 6 120 7 562 7 120 8 682 8 120 Refer to Table 14-4. What is the total revenue from selling 4 units?
When a perfectly competitive firm sells additional units of output, its total revenue will
A firm has a demand curve of 𝑄 = 25 − 0.5 𝑃 . Which of the following is the correct revenue curve for this firm? Note that the horizontal axis on each graph is quantity and the vertical axis is revenue.
Figure 14-2Suppose a firm operating in a competitive market has the following cost curves:Refer to Figure 14-2. If the market price is $10, what is the firm's total revenue?
更多留学生实用工具
希望你的学习变得更简单
加入我们,立即解锁 海量真题 与 独家解析,让复习快人一步!