题目
ECON 13210 94 Introduction to Macroeconomic Models Final Exam
单项选择题
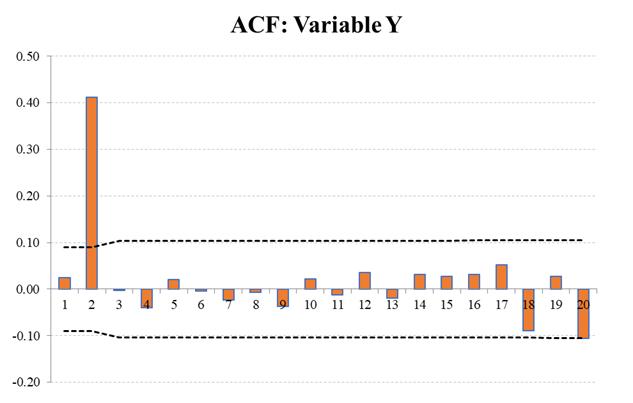
The following graph represents the ACF of variable Y: Which of the following statements is correct about the best time series model of variable Y?
选项
A.The best model for Y is an MA(1)
B.The best model for Y is an AR(2)
C.The best model for Y is an MA(2)
D.The best model for Y is an AR(1)
查看解析
标准答案
Please login to view
思路分析
To interpret the ACF graph for Y, I’ll evaluate what the pattern says about potential time-series structures.
Option 1: The best model for Y is an MA(1). The ACF shows a large spike at lag 1 with subsequent lags largely within the significance bounds and not showing a clear pattern of persistence. This is characteristi......Login to view full explanation登录即可查看完整答案
我们收录了全球超50000道考试原题与详细解析,现在登录,立即获得答案。
类似问题
You want to create a Time Series out of the Tourist dataset, and you want to call that time series: TouristDataTSWhat is the line of code in R, that will produce the TouristDataTS time series?___A___ <- ___B___ ( ___C___ , frequency = ___D___ , ___E___ = c(2011,1) )The above letters represents what you would type into RStudio. Please type in your answers below, EXACTLY, with the correct "case". Do NOT put any spaces in your answers below.___A: [input]B: [input]C: [input]D: [input]E: [input]
Give the single best correct answer.In time series for predicting seasonal data,[Fill in the blank]
The figure below shows which time series pattern?
A ski resort uses forecasts to plan staff schedules. It notices gradual increases and decreases in customer volume over several years depending on economic conditions. This pattern is best described as:
更多留学生实用工具
希望你的学习变得更简单
加入我们,立即解锁 海量真题 与 独家解析,让复习快人一步!