题目
单项选择题
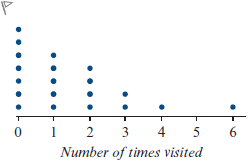
The shape of the data distribution displayed by this dot plot is best described as:
选项
A.a. symmetric
B.b. negatively skewed
C.c. positively skewed
D.d. none of the above
查看解析
标准答案
Please login to view
思路分析
To begin, let’s interpret the dot plot: most data points are clustered toward the lower end (near 0, 1, 2), with fewer observations as the values increase toward higher numbers, creating a stretch of data that trails off to the right.
Option a (symmetric): A symmetric distribution would have r......Login to view full explanation登录即可查看完整答案
我们收录了全球超50000道考试原题与详细解析,现在登录,立即获得答案。
类似问题
偏度衡量数值分布的对称性,不对称的分布称为偏斜分布。给定一个变量的直方图,下列哪种偏度类型最能描述该分布?
In a right-skewed distribution
Histograms (1 mark)Which of the following statements about the following histogram of data points in 'y' is true:[Fill in the blank]
If the shape of a distribution is skewed, with a long tail projecting longer to the left than to the right, how would the distribution be skewed?
更多留学生实用工具
希望你的学习变得更简单
加入我们,立即解锁 海量真题 与 独家解析,让复习快人一步!