题目
单项选择题
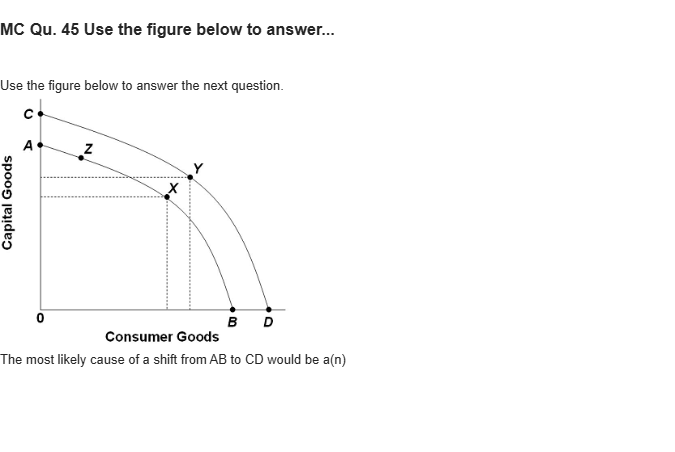
MC Qu. 45 Use the figure below to answer... Use the figure below to answer the next question. The horizontal axis is labeled consumer goods and lists markings from left to right as B and D. The vertical axis is labeled capital goods and lists markings from bottom to top as A and C. Two concentric curves are drawn from the vertical axis to the horizontal axis and the curves' overall shape is a quarter circle, approximately. First curve initiates from A and ends at B and the second curve initiates from C and ends at D. First curve has two points marked as Z and X. A point marked as Y is plotted on the second curve to the right. X and Y lies in a straight line at an approximately 45 degree angle with the origin. The most likely cause of a shift from AB to CD would be a(n)
选项
A.increase in the price level.
B.increase in productivity.
C.decrease in the size of the labor force.
D.recession.
查看解析
标准答案
Please login to view
思路分析
To analyze the question, first restate what the figure represents: two production possibility frontiers (PPFs) drawn as quarter circles, with AB representing the initial frontier and CD representing a farther-out frontier. Moving from AB to CD indicates that the economy can produce more of both capital goods and consumer goods than before, given the same resource base.
Option 1: increase in th......Login to view full explanation登录即可查看完整答案
我们收录了全球超50000道考试原题与详细解析,现在登录,立即获得答案。
类似问题
Given the production possibilities curve above, which of the following represents a movement from efficiency to inefficiency?
Refer to the production possibility curve for Marketopia below. The graph indicates that with the resources and technology it has available, Marketopia
Using the PPF graph below identify the points that are attainable with current resources.
Refer to the following graph to answer the next question. In the graph, Point C is a(n) _________ point.
更多留学生实用工具
希望你的学习变得更简单
加入我们,立即解锁 海量真题 与 独家解析,让复习快人一步!