题目
BIOL 1009 (001-006/050-055) Final Exam
单项选择题
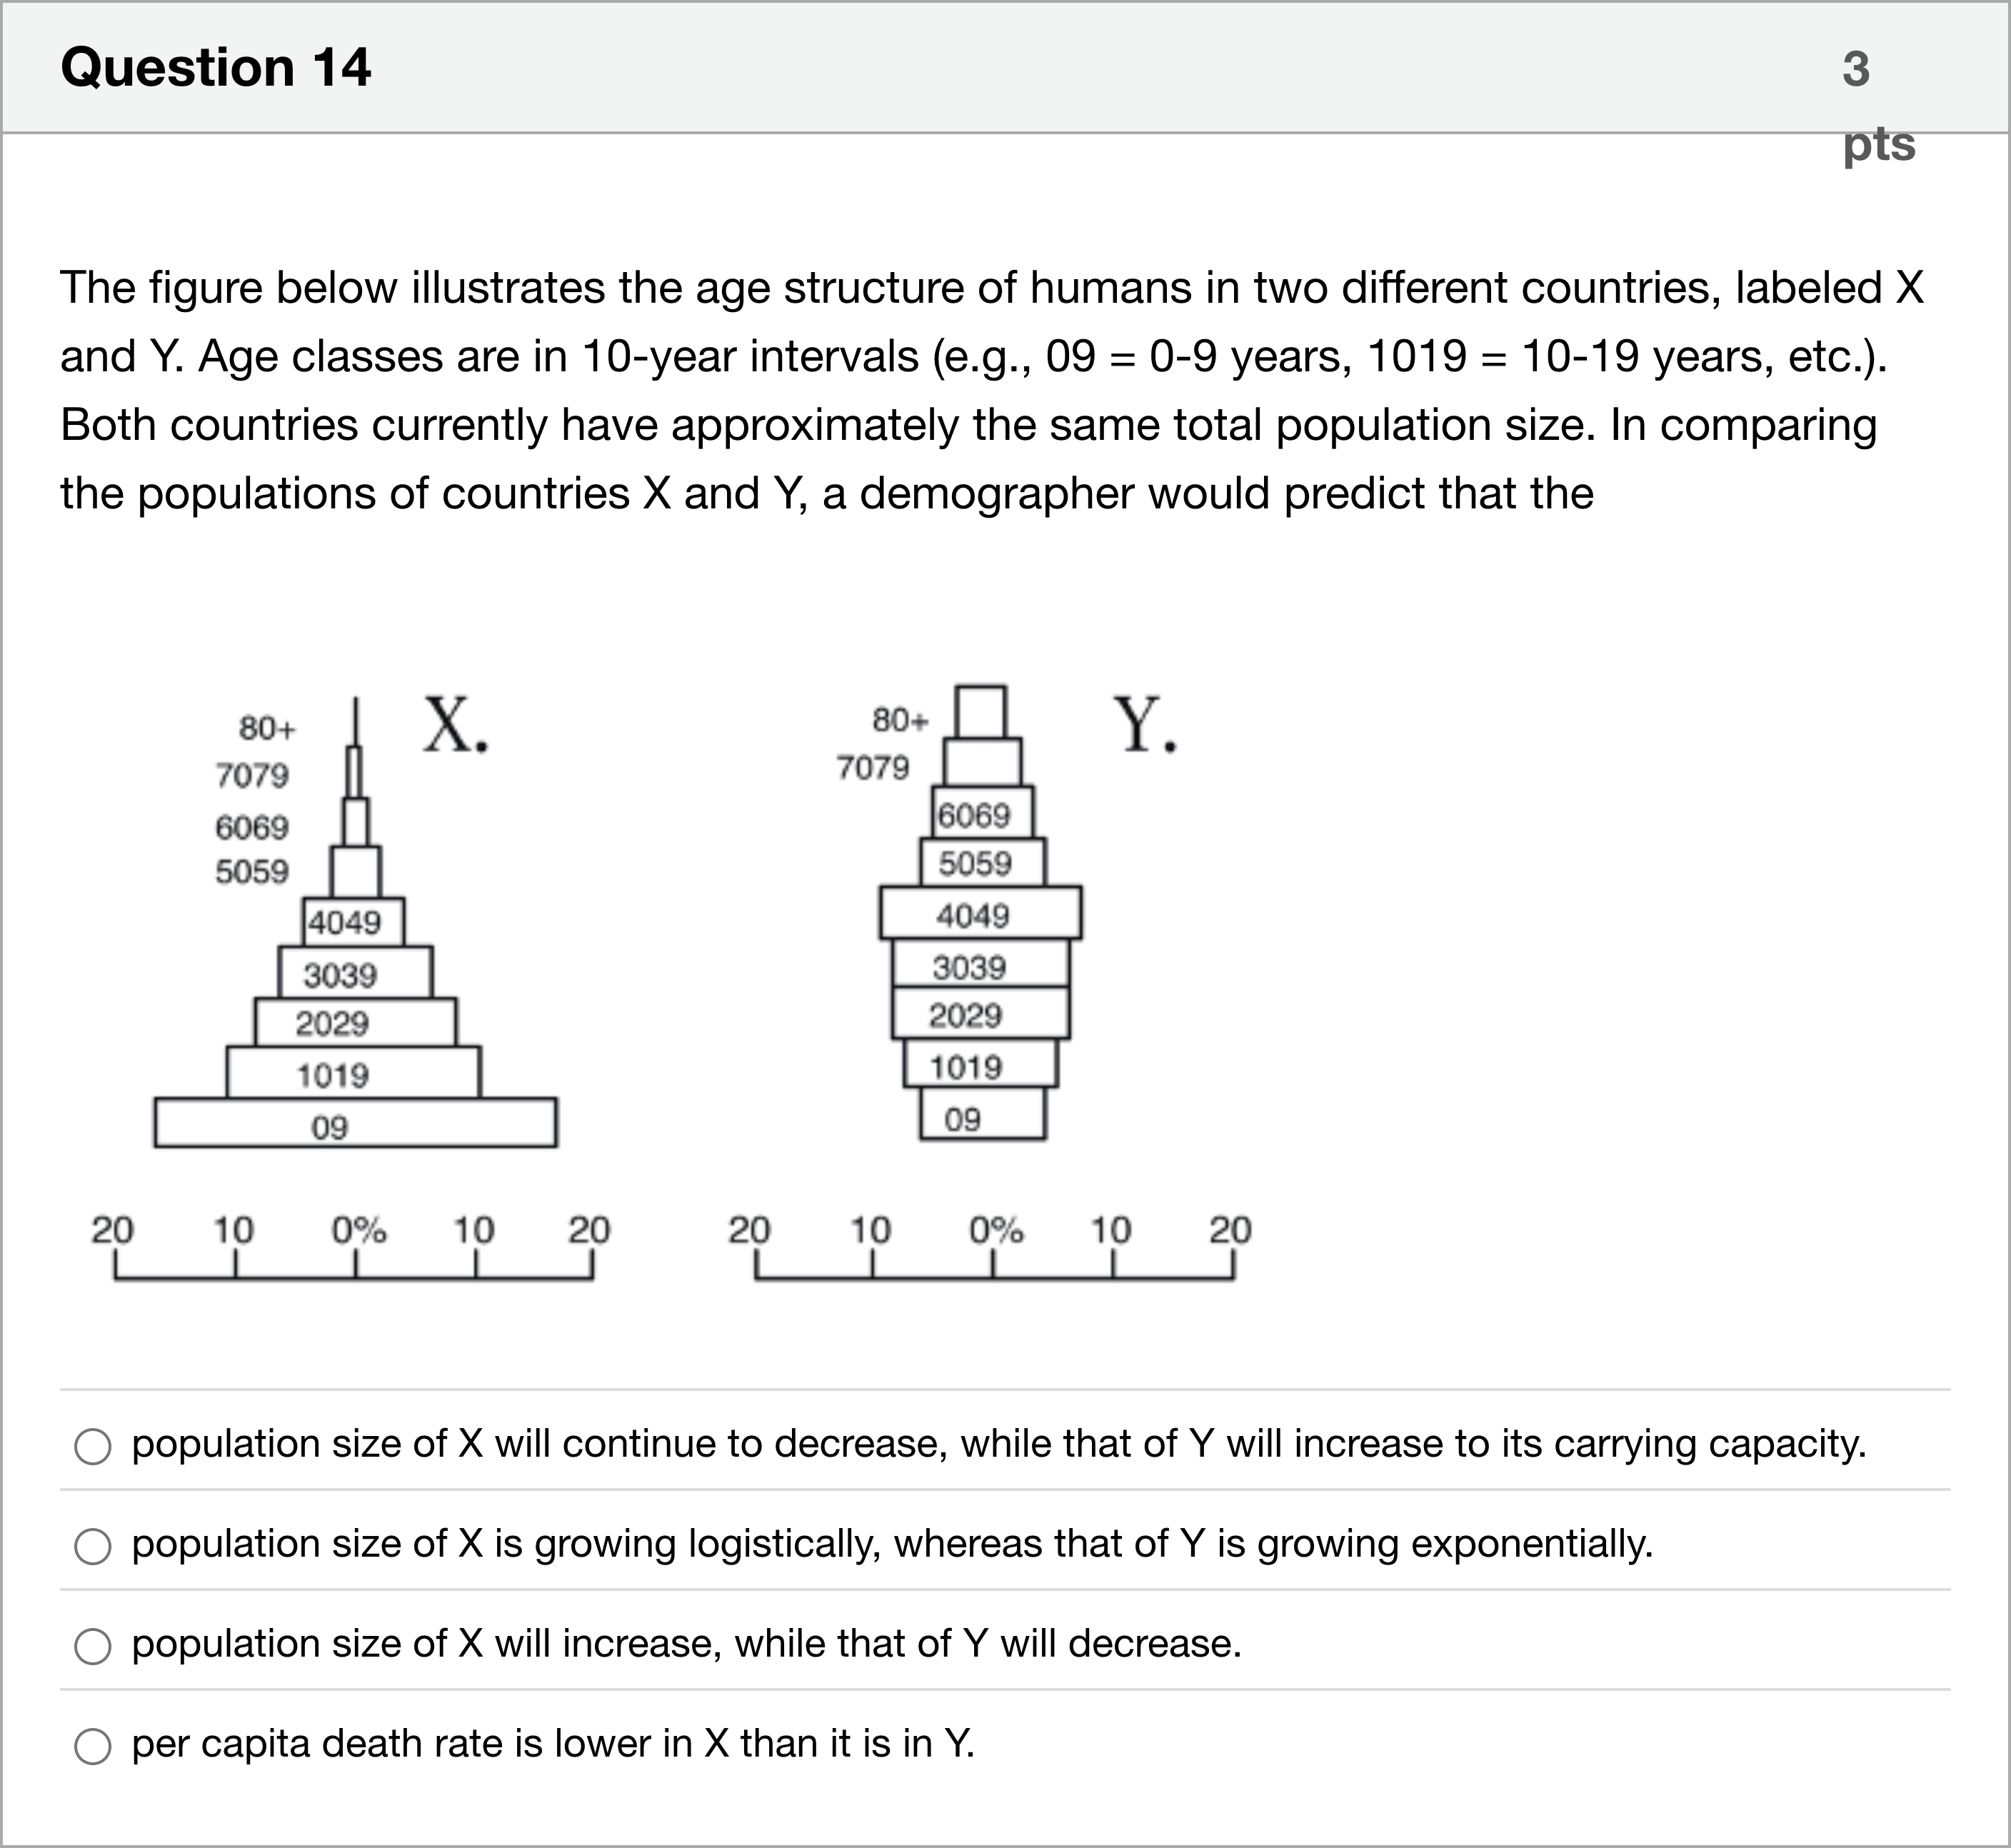
The figure below illustrates the age structure of humans in two different countries, labeled X and Y. Age classes are in 10-year intervals (e.g., 09 = 0-9 years, 1019 = 10-19 years, etc.). Both countries currently have approximately the same total population size. In comparing the populations of countries X and Y, a demographer would predict that the
选项
A.population size of X will continue to decrease, while that of Y will increase to its carrying capacity.
B.population size of X is growing logistically, whereas that of Y is growing exponentially.
C.population size of X will increase, while that of Y will decrease.
D.per capita death rate is lower in X than it is in Y.
查看解析
标准答案
Please login to view
思路分析
To analyze the two age-structure pyramids, I will examine what the width of each age class represents and what that implies about future population trends.
Option 1: "population size of X will continue to decrease, while that of Y will increase to its carrying capacity." This would be expected if X were aging-and-depleting while Y was expanding toward a carrying capacity. However, in the diagram, country X has a broad base (large number of youngsters) and a pyramidal shape indicating a young, growing population. Country Y shows a narrow base with relatively larger numbers in o......Login to view full explanation登录即可查看完整答案
我们收录了全球超50000道考试原题与详细解析,现在登录,立即获得答案。
类似问题
Every year you travel to the Kalahari Desert in Botswana to study meerkats (Suricata suricatta), a small carnivore belonging to the mongoose family. As you survey the various populations of meerkats and analyze the data, you realize that population growth is most influenced by the…
The formula, r = (b – d) + (i – e), demonstrates that an increase in population size can be attributed to an increase in…
What were the ecological consequences of the rinderpest parasite for wildebeests and buffalo in the African Savannah? Choose 2 answers.
2A. A large population of bats living in a small cave get White-nose syndrome, a fungal disease that is fatal to bats. The disease quickly spreads throughout the entire population and kills the majority of bats in the cave. One infected bat escapes and flies to a large cave system nearby that has a few bats scattered throughout, but the bat dies before the population in this cave system is infected. What type of population dynamic does this situation represent?
更多留学生实用工具
希望你的学习变得更简单
加入我们,立即解锁 海量真题 与 独家解析,让复习快人一步!