题目
PSYC20009_2025_SM2 Lecture 3 Quiz
单项选择题
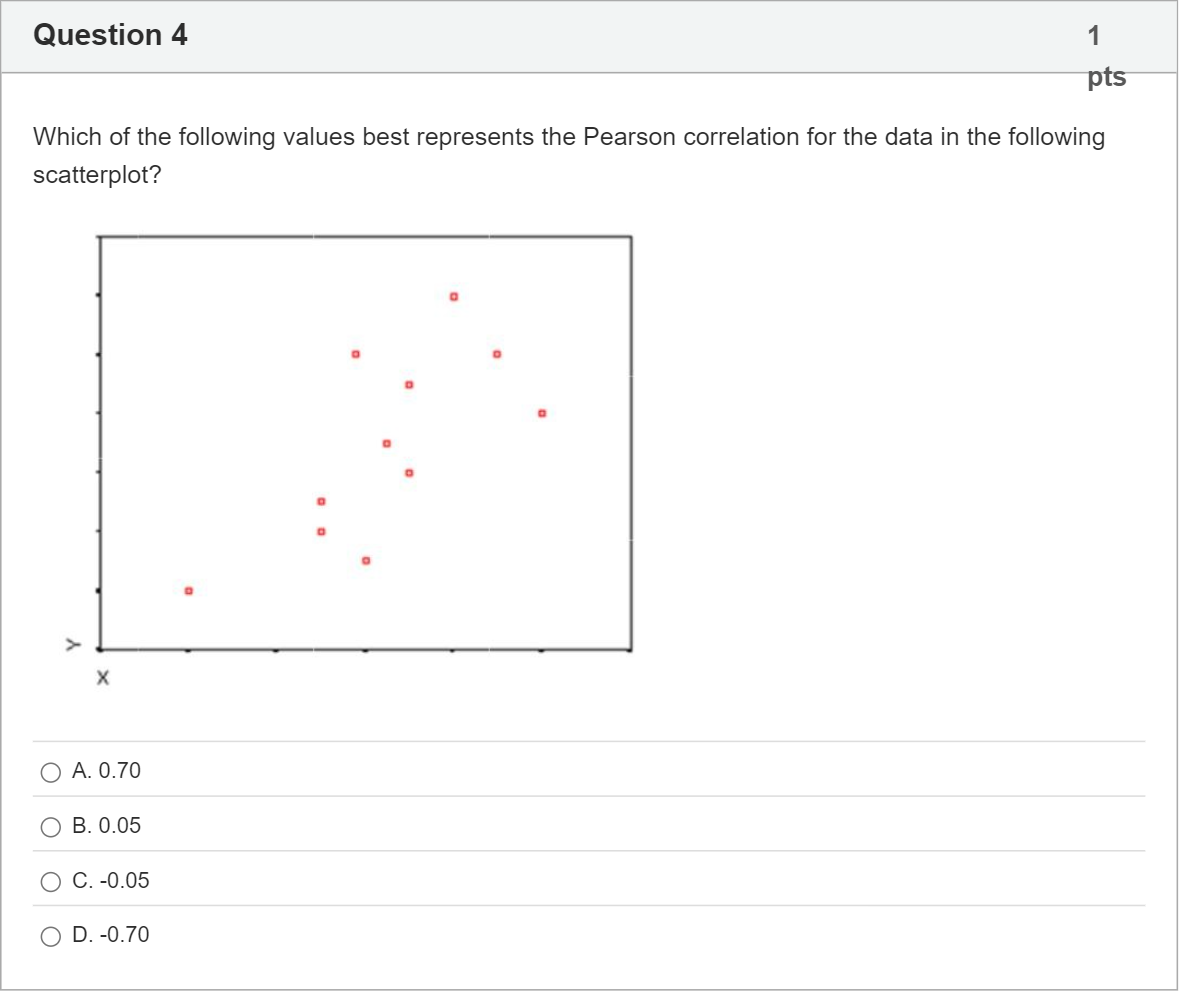
Which of the following values best represents the Pearson correlation for the data in the following scatterplot?
选项
A.A. 0.70
B.B. 0.05
C.C. -0.05
D.D. -0.70
查看解析
标准答案
Please login to view
思路分析
Interpreting the scatterplot, the data show a clear upward (positive) trend: as X increases, Y tends to increase as well. The points are fairly closely clustered around an ascending line, indic......Login to view full explanation登录即可查看完整答案
我们收录了全球超50000道考试原题与详细解析,现在登录,立即获得答案。
类似问题
Which of the following values best represents the Pearson correlation for the data in the following scatterplot?
A researcher is interested in examining the relationship between the number of bears in an area (Y) and its human population (X). The scatterplot of the data is reproduced below. This scatterplot would suggest that the correlation (Pearson’s r) for this distribution would be:
You take a sample of n = 70 from a population of adolescents, and conduct a correlation analysis to investigate the relationship between level of anxiety and time spent exercising. Both variables are measured continuously via self-report questionnaires. You find that r = -.45 and p < .05. What can you conclude on the basis of your sample?
You are given the following scatterplot, with Variable A on the Y-Axis and Variable B on the X-Axis: If the axes are then swapped, such that Variable B is now on the Y-Axis, and Variable A is now on the X-Axis, what could you say about the change in the value of Pearson’s correlation coefficient (r)?
更多留学生实用工具
希望你的学习变得更简单
加入我们,立即解锁 海量真题 与 独家解析,让复习快人一步!