题目
多项填空题
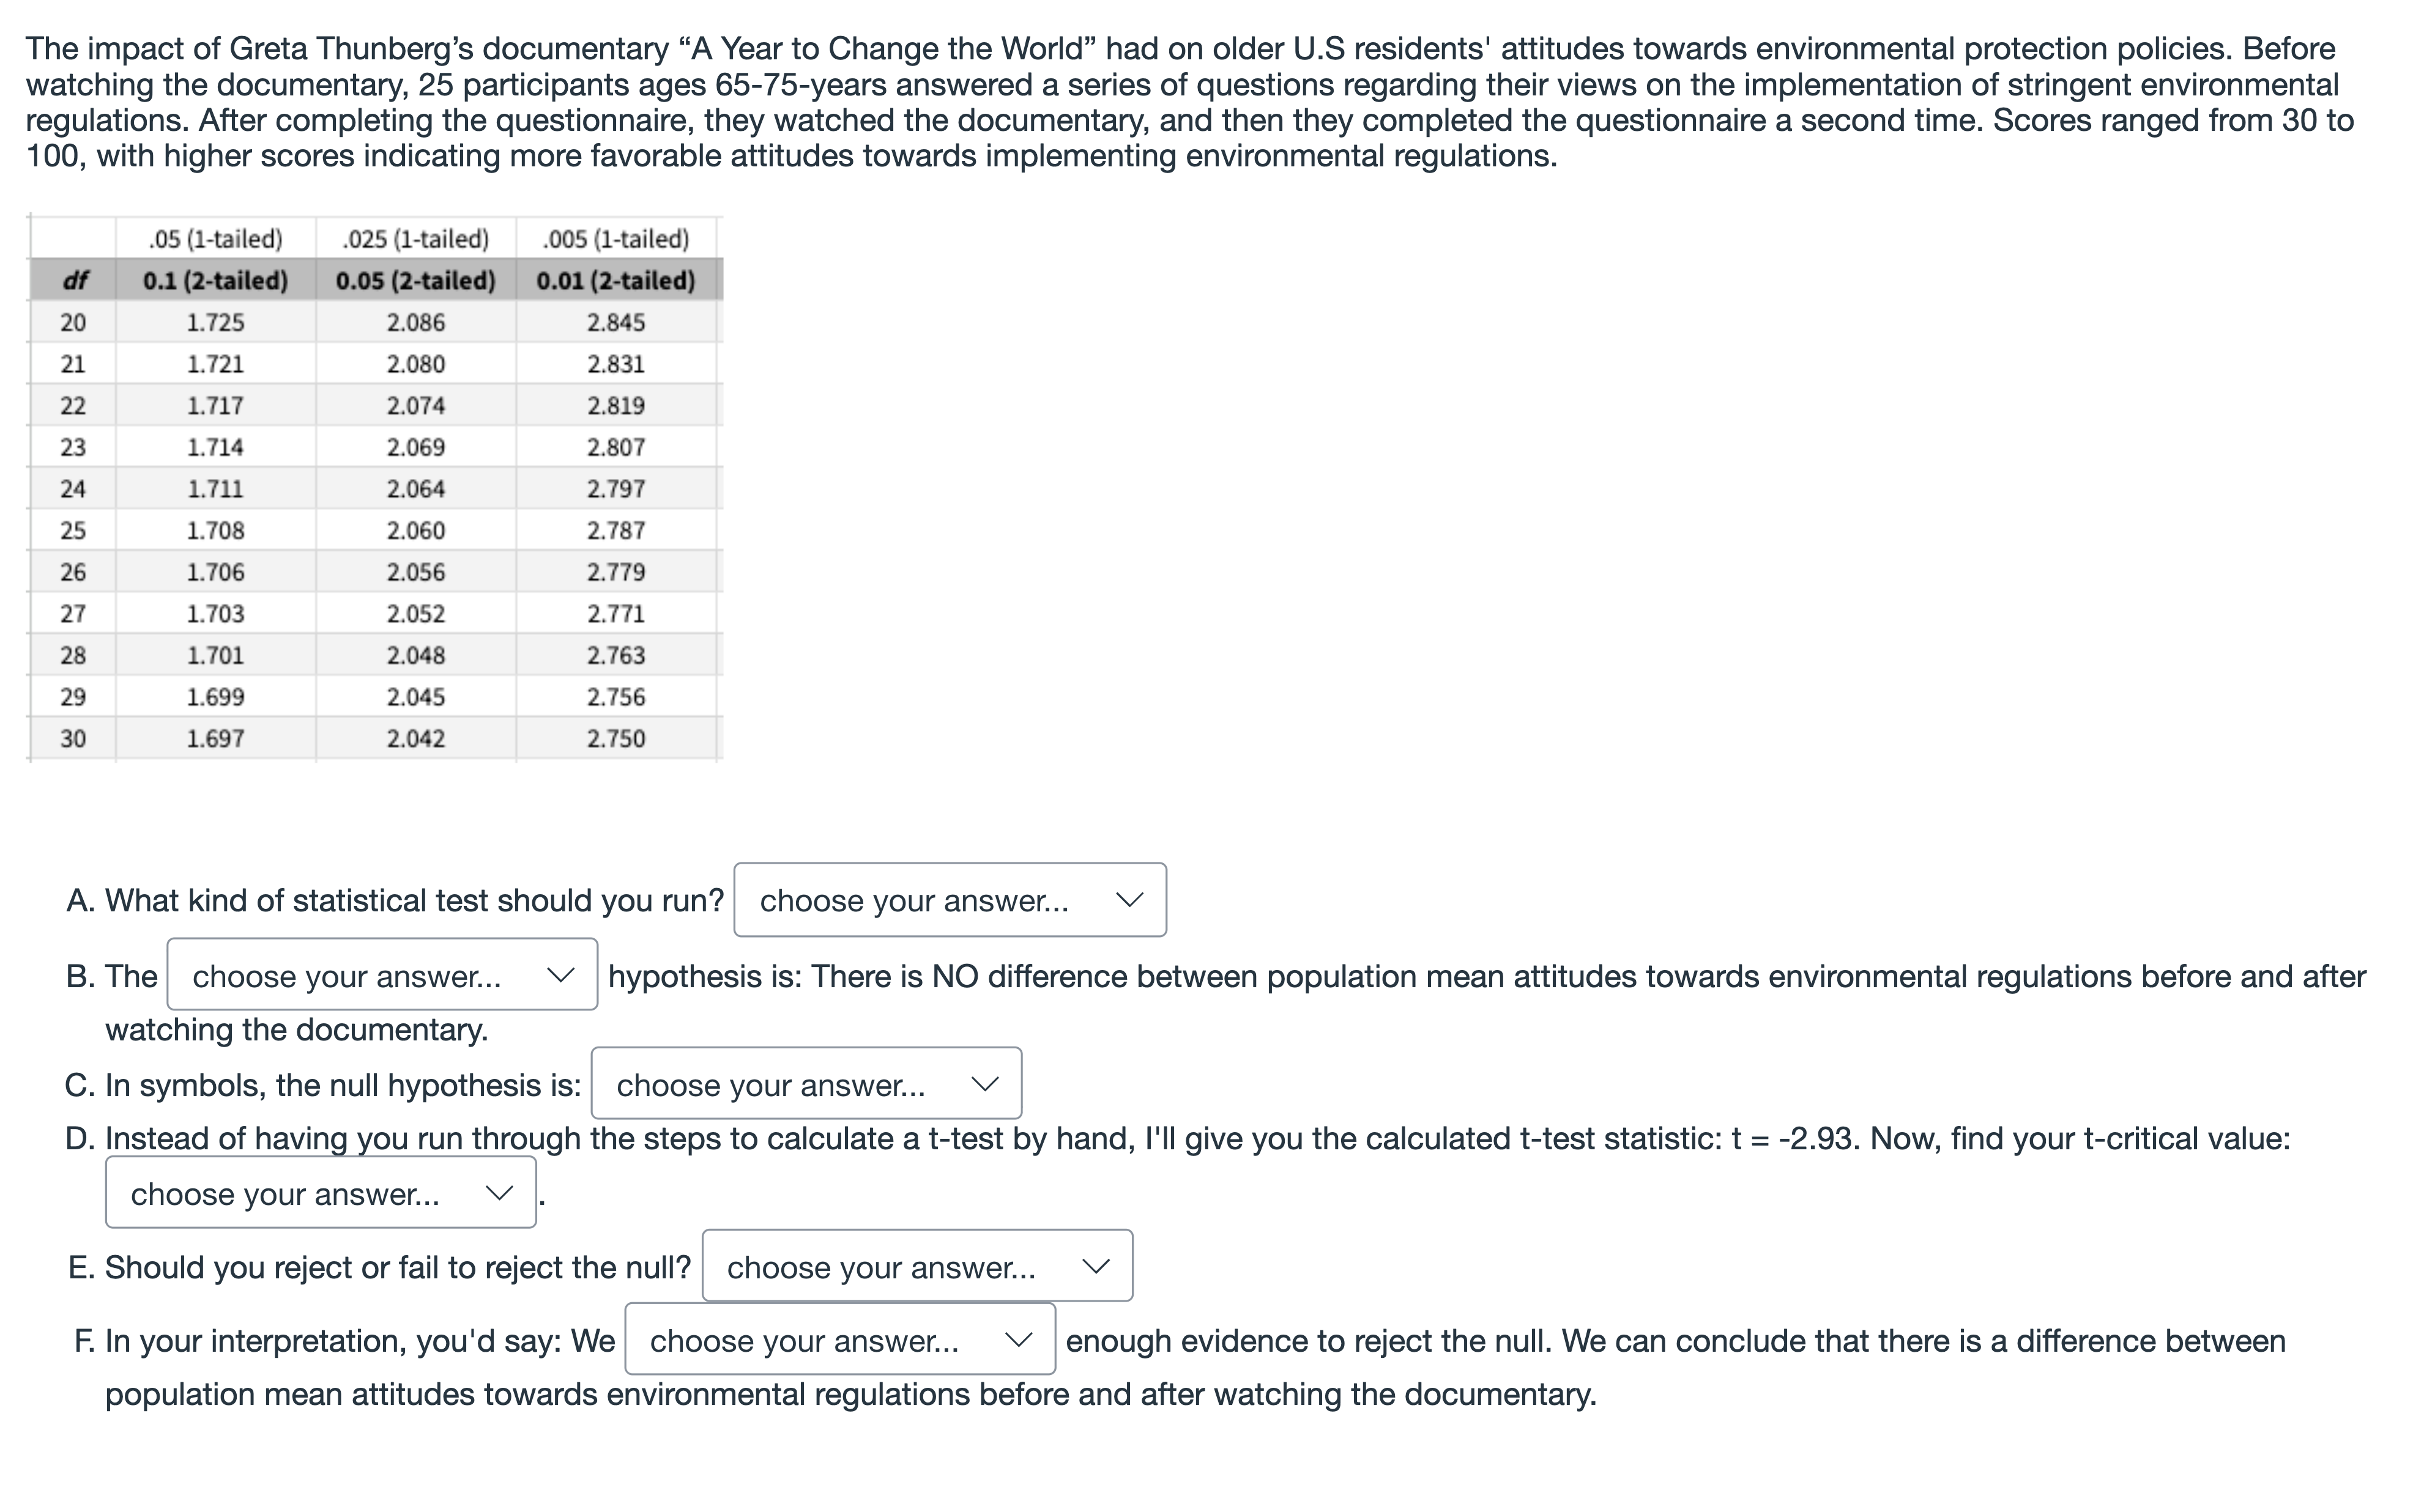
Question at position 27 The impact of Greta Thunberg’s documentary “A Year to Change the World” had on older U.S residents' attitudes towards environmental protection policies. Before watching the documentary, 25 participants ages 65-75-years answered a series of questions regarding their views on the implementation of stringent environmental regulations. After completing the questionnaire, they watched the documentary, and then they completed the questionnaire a second time. Scores ranged from 30 to 100, with higher scores indicating more favorable attitudes towards implementing environmental regulations. What kind of statistical test should you run? Printed Blank[input]Question Blank 1 of 6[input] The Printed Blank[input]Question Blank 2 of 6[input] hypothesis is: There is NO difference between population mean attitudes towards environmental regulations before and after watching the documentary. In symbols, the null hypothesis is: Printed Blank[input]Question Blank 3 of 6[input] Instead of having you run through the steps to calculate a t-test by hand, I'll give you the calculated t-test statistic: t = -2.93. Now, find your t-critical value: Printed Blank[input]Question Blank 4 of 6[input]. Should you reject or fail to reject the null? Printed Blank[input]Question Blank 5 of 6[input] In your interpretation, you'd say: We Printed Blank[input]Question Blank 6 of 6[input] enough evidence to reject the null. We can conclude that there is a difference between population mean attitudes towards environmental regulations before and after watching the documentary. independent samples t-test1-sample t-testdependent samples t-testcorrelationz-testalternativenullµ = 30µ ≠ 30µbefore = µafterµbefore ≠ µafter2.0642.0602.0522.056fail to rejectrejectdo not havehave
选项
A.
B.
C.
D.
E.
F.
G.
H.
I.
J.
K.
L.
查看解析
标准答案
Please login to view
思路分析
The question presents a within-subjects design where the same 25 participants completed a questionnaire before and after watching the documentary, and asks which test and corresponding statements fit.
Option A: 'dependent samples t-test' — This is the correct type of test for comparing two related means (pre- and post-test on the same individuals). A paired (dependent) t-test accounts for the relatedness of the measurements and typically yields more power than an independent t-test in this design.
O......Login to view full explanation登录即可查看完整答案
我们收录了全球超50000道考试原题与详细解析,现在登录,立即获得答案。
类似问题
Forty-five families are randomly selected and their daily water usage (in gallons) before and after viewing a water conservation video is measured. What is the appropriate null hypothesis to determine if the mean amount of water conserved between the before and after measurements significantly differs.
A coach uses a new technique to train gymnasts. 7 gymnasts were randomly selected and their competition scores were recorded before and after the training. The results are shown below. Subject A B C D E F G Before 9.5 9.4 9.6 9.5 9.5 9.6 9.7 After 9.6 9.6 9.6 9.4 9.6 9.9 9.5 Using a 0.01 level of significance, test the claim that the training technique is effective in raising the gymnasts' scores. (Before-After) Complete the following analysis. 1. This is a [ Select ] right two left -tailed test. 2. The test statistic is equal to t=-0.88 . 3. If the value of the test statistic is less than -3.14 then you will reject the null hypothesis. 4. If the P-value is less than [ Select ] .005 .01 .1 .05 , then you will reject the null hypothesis. 5. The P-value is equal to [ Select ] 0.21 0.054 .14 0.05 . 6. [ Select ] Fail to reject Reject the null hypothesis. 7. At the 1% significance level, there [ Select ] is is not evidence to support the claim that the technique is effective in raising the gymnasts' scores. (You should technically be checking graphs to make sure that certain assumptions are met. Of course, this data doesn't meet these conditions, so in real life you wouldn't do this analysis. You would need another method than what I have given you. However, we are just going to check that we can do the computations, even if they are meaningless in this case.)
When should we use a matched pairs method for testing two population means?
The 90% CI for 𝜇 𝑑 is (0.7, 0.84) when performing inference of dependent data, which of the following would be a plausible p-value when testing the corresponding hypotheses about the mean difference of dependent data?
更多留学生实用工具
希望你的学习变得更简单
加入我们,立即解锁 海量真题 与 独家解析,让复习快人一步!