题目
单项选择题
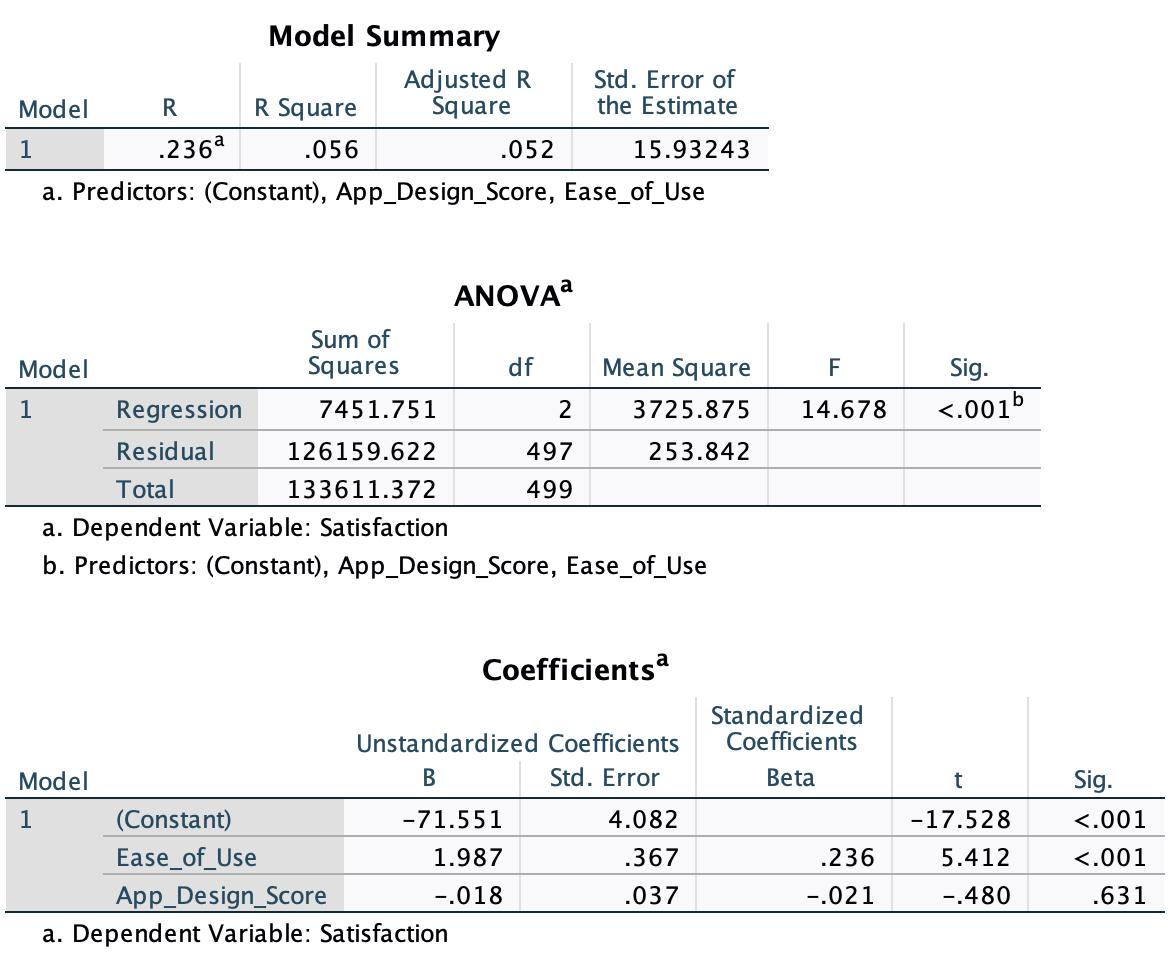
Based on the regression output below, which of the following is the most appropriate interpretation? In this regression analysis, the dependent variable is the satisfaction with the new gaming app. The independent variables include design score and ease-of-use.
查看解析
标准答案
Please login to view
思路分析
In this regression output, the dependent variable is Satisfaction and the key predictor shown is Ease_of_Use, along with App_Design_Score.
First, observe the Coefficients table: the unstandardized coefficient for Ease_of_Use is 1.987 with a standard error of .367, and the t-statistic is 5.412 with a p-value (Sig.) less than .001. This indicates a statistically significant positive relationship between Ease_of_Use and Satisfaction: as Ease_of_Use increases by one unit, S......Login to view full explanation登录即可查看完整答案
我们收录了全球超50000道考试原题与详细解析,现在登录,立即获得答案。
类似问题
Question22 Which statement about multiple linear regression is INCORRECT? Select one alternative: It can be represented by an equation such as y = b0 + b1 * x1 + b2 * x2 + … + bn * xn. It models the relationship between one dependent variable and two or more independent variables It can be used to model nonlinear relationships without any transformation. It assumes a linear relationship between the dependent and independent variables. ResetMaximum marks: 2 Flag question undefined
Question22 Which statement about multiple linear regression is INCORRECT? Select one alternative: It can be represented by an equation such as y = b0 + b1 * x1 + b2 * x2 + … + bn * xn. It assumes a linear relationship between the dependent and independent variables. It can be used to model nonlinear relationships without any transformation. It models the relationship between one dependent variable and two or more independent variables ResetMaximum marks: 2 Flag question undefined
PlanFinan is a financial planning organisation. The data in PlanFinan1.xlsx was obtained from PlanFinan’s database of a particular group of clients. Use Excel to obtain a multiple linear regression of the variable "Savings" (Y) on the variables "Cars" (X1) and “Salary” (X2). According to the regression output, the predicted amount of savings is Answer Question 9[input] thousand dollars, if the car value is $55,000 and the salary is $103,000. (Please round your answer to 3 decimal places)
PlanFinan is a financial planning organisation. The data in PlanFinan1.xlsx was obtained from PlanFinan’s database of a particular group of clients. Use Excel to obtain a multiple linear regression of the variable "Home" (Y) on the variables "Salary" (X1) and “Savings” (X2). We want to test whether there is a significant linear relationship between the value of home and the two independent variables. According to the regression output, what is the p-value for the test?
更多留学生实用工具
希望你的学习变得更简单
加入我们,立即解锁 海量真题 与 独家解析,让复习快人一步!