题目
COMM_V 191 201 202 203 204 2024W2 2024W2 COMM 191 Midterm - Friday, March 7, 2025
单项选择题
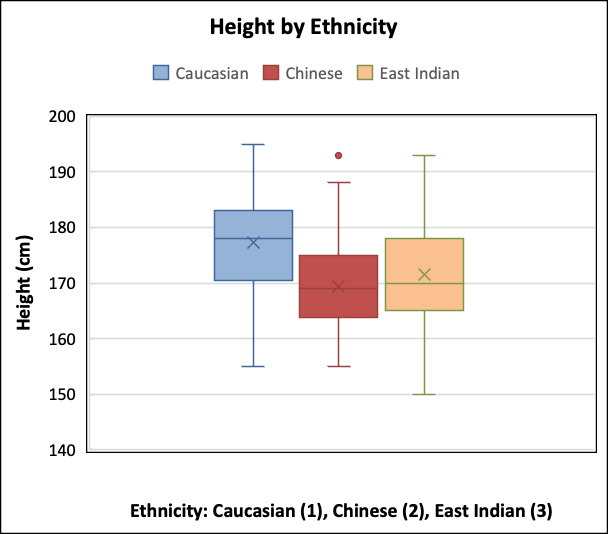
The following are histograms of quiz scores for four different classes. Which distribution shows the MOST variability? (Select the best answer)
选项
A.Class 1
B.Class 2
C.Class 3
D.Class 4
查看解析
标准答案
Please login to view
思路分析
First, I will restate the question and the answer choices to be clear about what we are evaluating.
Question: The following are histograms (boxplots) of quiz scores for four different classes. Which distribution shows the MOST variability? (Select the best answer)
Answer options: Class 1, Class 2, Class 3, Class 4
Now, let's analyze each option in turn by considering variability, which is captured by the overall spread of the data (the d......Login to view full explanation登录即可查看完整答案
我们收录了全球超50000道考试原题与详细解析,现在登录,立即获得答案。
类似问题
Which of the following statements is TRUE about the measures of variability? (Multiple selection is allowed)
Question at position 16 The simplest measure of variability is the _____.standard deviationvariancecoefficient of variationrangeClear my selection
Three companies (company A, Company B, and Company C) are asked to supply a specific type of concrete for a project and are requested to submit results from a trial batches of that mix which were tested for compressive strength. The distribution of compressive strength tests for each of the three companies are shown below. Which of the following is a TRUE statement?
The sheet “Elecmart” in the data file Quiz 2.xlsx provides information on a sample of 400 customer orders during a period of several months for E-mart. Generate summary statistics of the amount spent (Spent) for female and male customers separately using Data Analysis Toolpak or Excel functions. Which of the following measures shows a higher variability for females compared to males?
更多留学生实用工具
希望你的学习变得更简单
加入我们,立即解锁 海量真题 与 独家解析,让复习快人一步!