题目
ECON 2002.01 AU2025 (21333) Midterm Exam 3 - Requires Respondus LockDown Browser
单项选择题
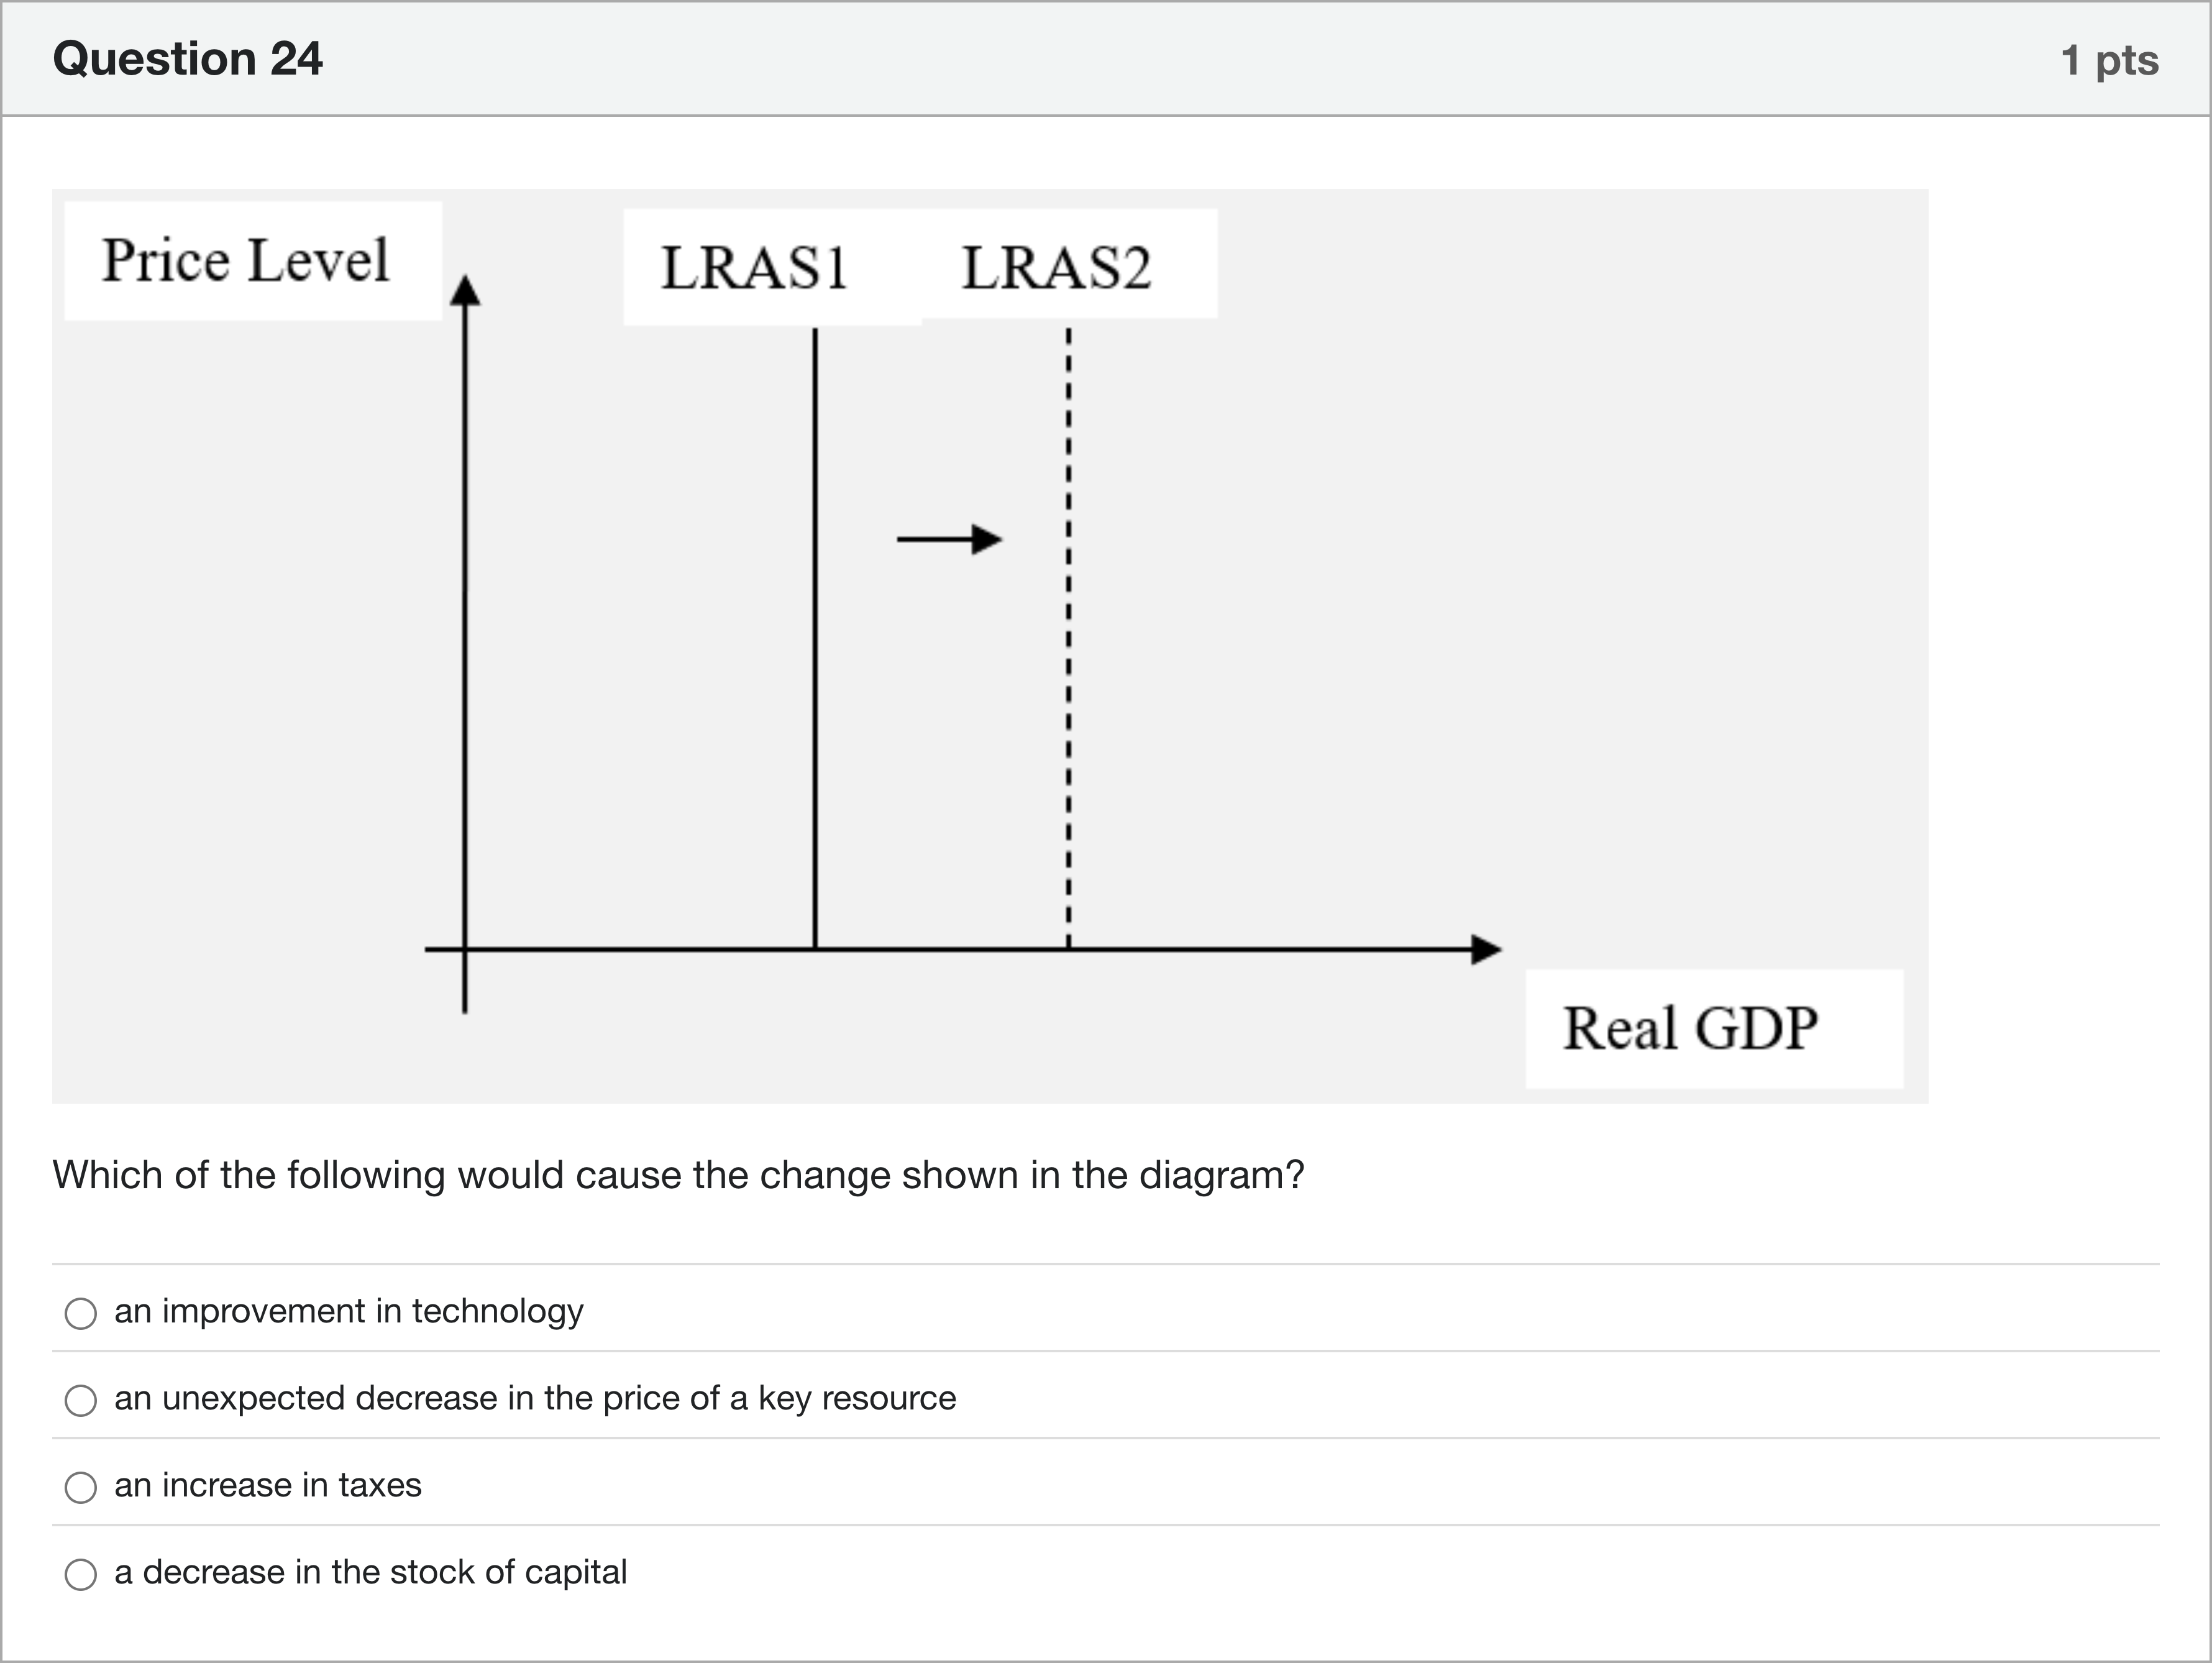
Which of the following would cause the change shown in the diagram?
选项
A.an improvement in technology
B.an unexpected decrease in the price of a key resource
C.an increase in taxes
D.a decrease in the stock of capital
查看解析
标准答案
Please login to view
思路分析
To determine what would cause the change depicted, we first consider what the diagram shows: a shift of the long-run aggregate supply (LRAS) curve to the right from LRAS1 to LRAS2, with the price level on the vertical axis and Real GDP on the horizontal axis. This indicates an increase in the economy’s potential output or productive capacity rather than a movement along the existing supply curve.
Option 1: an improvement in t......Login to view full explanation登录即可查看完整答案
我们收录了全球超50000道考试原题与详细解析,现在登录,立即获得答案。
类似问题
The long-run aggregate supply curve is vertical at the level of output:
In the long run, the output of the economy:
In countries that have high minimum wages and require a lengthy and costly process to get permission to open a business,
In the figure above, what do the classical/neoclassical economists suggest in terms of achieving full employment in the Long Run?
更多留学生实用工具
希望你的学习变得更简单
加入我们,立即解锁 海量真题 与 独家解析,让复习快人一步!