题目
单项选择题
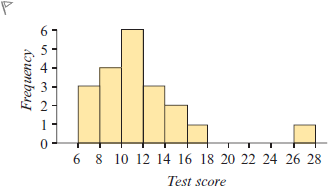
The histogram below displays the testscores of a class of students. The number of students is:
选项
A.a. 6
B.b. 18
C.c. 20
D.d. 21
查看解析
标准答案
Please login to view
思路分析
To determine how many students there are, we need to add the frequencies shown by each bar in the histogram.
Option a. 6: The first bar around score 6 contributes a small frequency, roughly 2 students.
Option b. 18: The next bar around......Login to view full explanation登录即可查看完整答案
我们收录了全球超50000道考试原题与详细解析,现在登录,立即获得答案。
类似问题
To show how many customers must wait each night for a table, and how long they wait, which tool would work best?
Question at position 11 The goal regarding using an appropriate number of bins is to show the _____.correlation in the datanumber of observationsvariation in the datanumber of variablesClear my selection
In a histogram, used to give a graphical display of a distribution of sample data, what does the Y axis represent?
In a histogram, used to give a graphical display of a distribution of sample data, what does the X axis represent?
更多留学生实用工具
希望你的学习变得更简单
加入我们,立即解锁 海量真题 与 独家解析,让复习快人一步!