题目
单项选择题
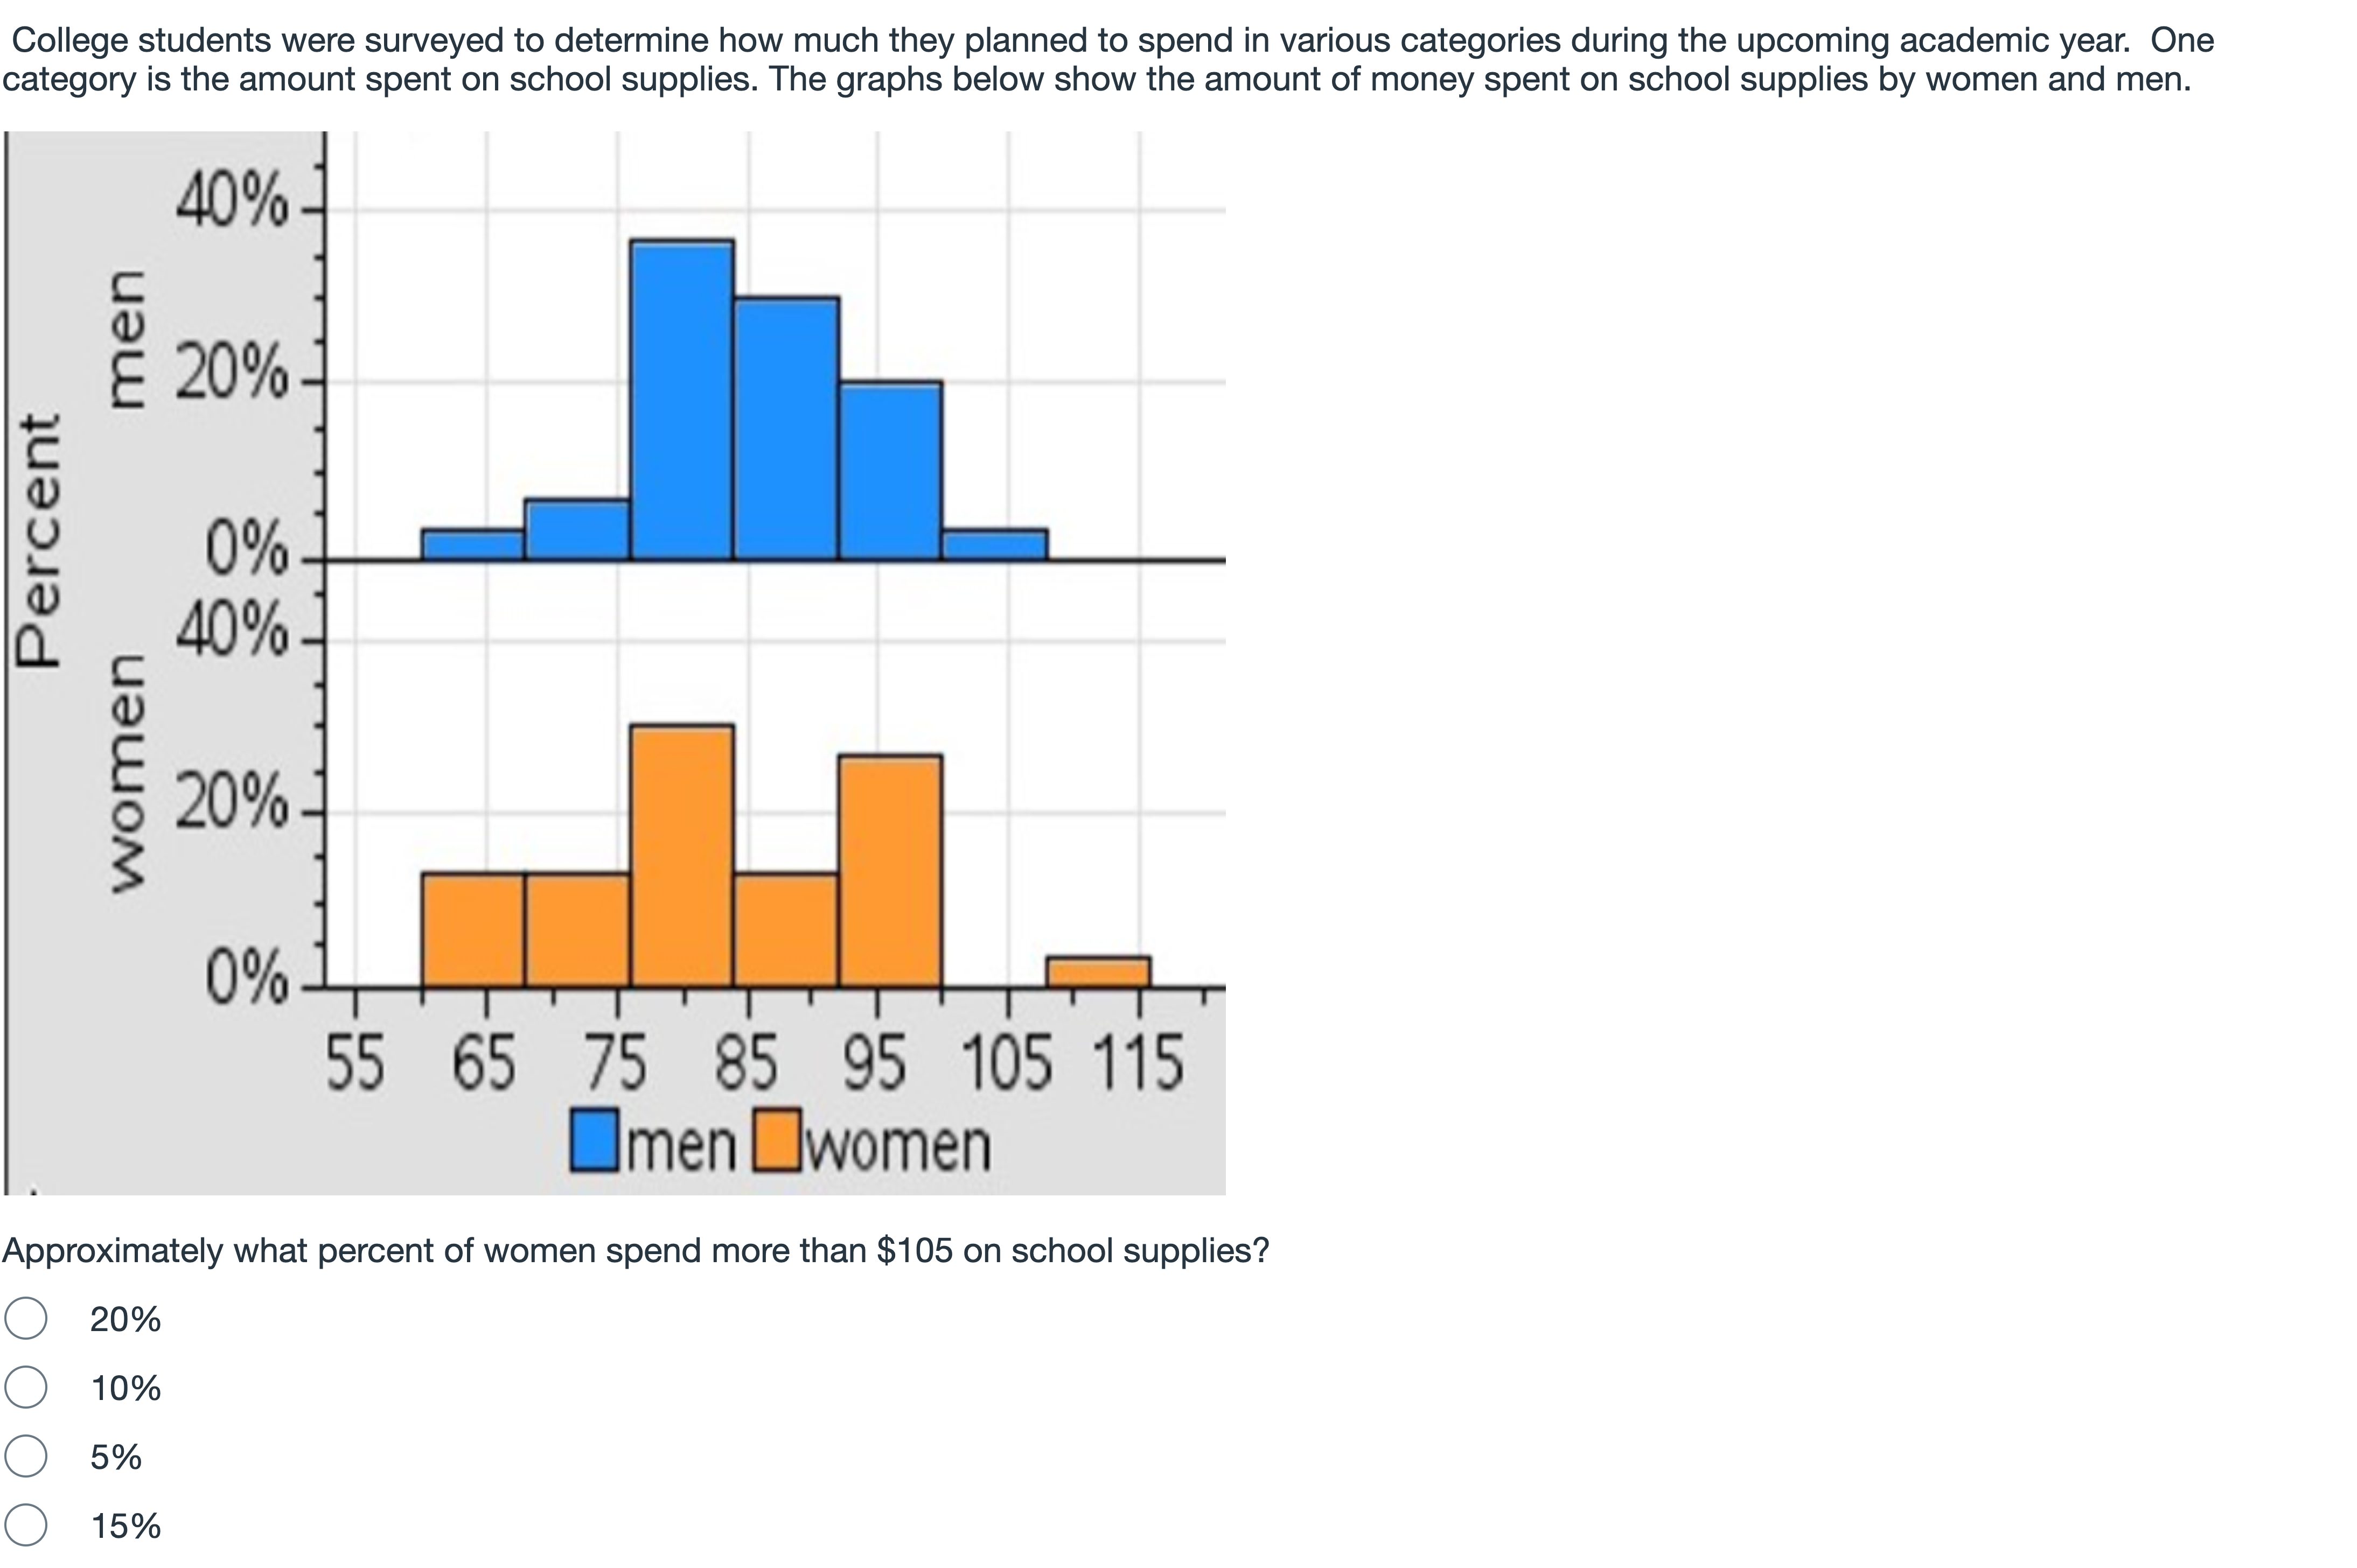
位置14的问题 College students were surveyed to determine how much they planned to spend in various categories during the upcoming academic year. One category is the amount spent on school supplies. The graphs below show the amount of money spent on school supplies by women and men. Approximately what percent of women spend more than $105 on school supplies?20%10%5%15%
选项
A.20%
B.10%
C.5%
D.15%
查看解析
标准答案
Please login to view
思路分析
To interpret the question, we focus on the orange bars representing women in the chart, specifically the range above $105.
Option 20%: This would require a fairly tall orange bar in the 105–115 range, but the bar there is quite small, i......Login to view full explanation登录即可查看完整答案
我们收录了全球超50000道考试原题与详细解析,现在登录,立即获得答案。
类似问题
To show how many customers must wait each night for a table, and how long they wait, which tool would work best?
Question at position 11 The goal regarding using an appropriate number of bins is to show the _____.correlation in the datanumber of observationsvariation in the datanumber of variablesClear my selection
In a histogram, used to give a graphical display of a distribution of sample data, what does the Y axis represent?
In a histogram, used to give a graphical display of a distribution of sample data, what does the X axis represent?
更多留学生实用工具
希望你的学习变得更简单
加入我们,立即解锁 海量真题 与 独家解析,让复习快人一步!