题目
多重下拉选择题
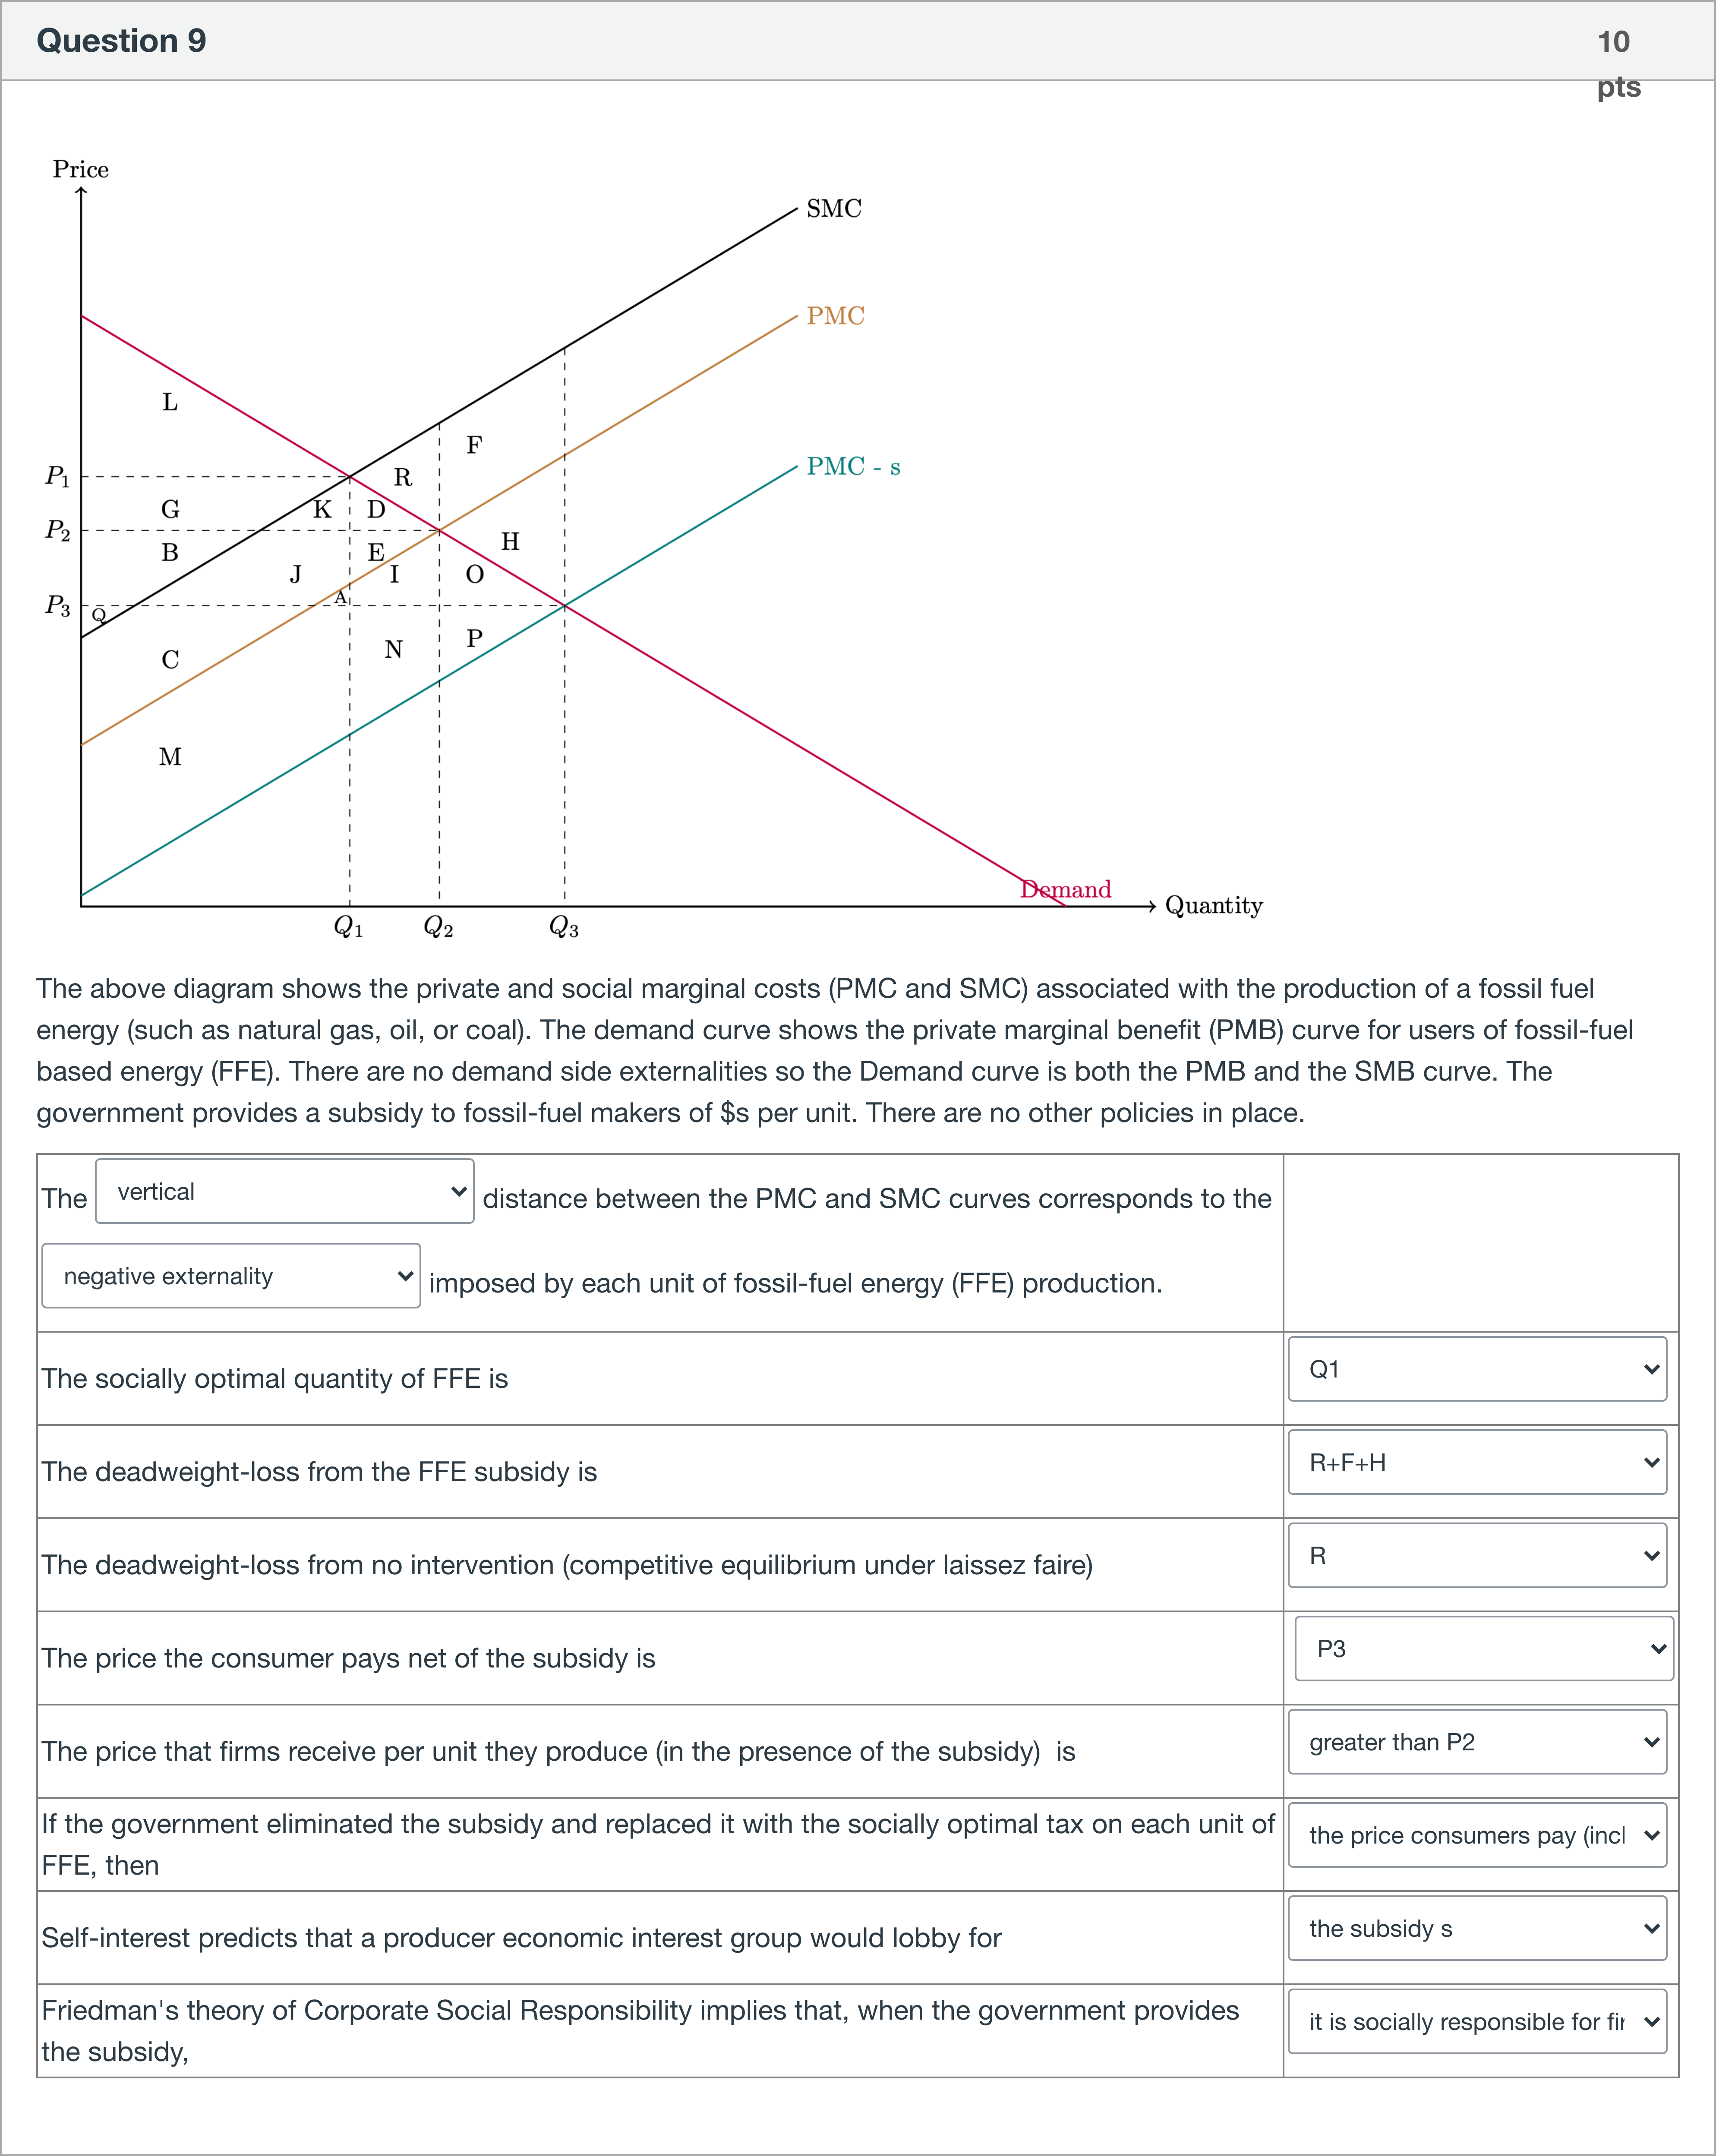
The above diagram shows the private and social marginal costs (PMC and SMC) associated with the production of a fossil fuel energy (such as natural gas, oil, or coal). The demand curve shows the private marginal benefit (PMB) curve for users of fossil-fuel based energy (FFE). There are no demand side externalities so the Demand curve is both the PMB and the SMB curve. The government provides a subsidy to fossil-fuel makers of $s per unit. There are no other policies in place. The [ Select ] vertical horizontal distance between the PMC and SMC curves corresponds to the [ Select ] abatement negative externality positive externality imposed by each unit of fossil-fuel energy (FFE) production. The socially optimal quantity of FFE is [ Select ] Q3 Q1 Q2 The deadweight-loss from the FFE subsidy is [ Select ] R+F+H D+E F+H O+P The deadweight-loss from no intervention (competitive equilibrium under laissez faire) [ Select ] D+E+I+N+O+P R R+F+H D The price the consumer pays net of the subsidy is [ Select ] P3-s P3 greater than P2 The price that firms receive per unit they produce (in the presence of the subsidy) is [ Select ] less than P3 greater than P2 P2 P1 If the government eliminated the subsidy and replaced it with the socially optimal tax on each unit of FFE, then [ Select ] the new deadweight loss would be area R consumer surplus would fall by the amount shown in area L the price consumers pay (including the tax) would rise to P1 the new deadweight loss would be area D+E Self-interest predicts that a producer economic interest group would lobby for [ Select ] the optimal tax laissez faire (no intervention) the subsidy s Friedman's theory of Corporate Social Responsibility implies that, when the government provides the subsidy, [ Select ] it is socially responsible for firms to lobby for the optimal tax it is socially responsible for firms to produce output Q2 it is socially responsible for firms to produce Q3 under the subsidy
查看解析
标准答案
Please login to view
思路分析
The question presents a diagram and a set of fill-in selections about a fossil-fuel energy (FFE) market with a government subsidy. We will evaluate each statement and explain why the chosen option makes sense (and why the alternatives do not).
The vertical distance between PMC and SMC corresponds to the negative externality per unit of FFE production. In diagrams of private vs. social costs, PMC (private marginal cost) and SMC (social marginal cost) diverge by the external cost. Since the externality here is negative (pollution, health costs, etc.), the gap is the per-unit external cost; this is a vertical distance on the graph. Therefore the correct pairing is the vertical distance and the negative externality.
The socially optimal quantity of FFE is Q1. In this setup, the social optimum equates the social marginal benefit (which equals PMB here, since there are no......Login to view full explanation登录即可查看完整答案
我们收录了全球超50000道考试原题与详细解析,现在登录,立即获得答案。
类似问题
If a positive externality exists in the consumption of a good, the private market equilibrium quantity will be
Which is true of a market that has allocational inefficiency (DWL) due to negative externalities? The competitive equilibrium output of that good is lower than the social optimum. [ Select ] The competitive equilibrium output of that good his higher than the social optimum. [ Select ] Social marginal costs at the competitive equilibrium are lower than private marginal costs. [ Select ] Property rights are well defined and transaction costs are low. [ Select ]
Consider the following statements about externalities and environmental policy, which of the following are true/false? The effect of a carbon tax on prices will be lower when demand is price-ineleastic. False The market distortions from a negative externality could be eliminated by the creation of a market, where tradable permits allocate pollution rights'' that can be priced and traded. [ Select ] The optimal tax is smaller than the negative externality because taxes create deadweight losses. [ Select ] Since abatement creates positive externalities its optimal level is always positive. [ Select ] When taxing negative externalities, the government gets revenues while reducing deadweight losses. [ Select ]
The positive externalities exist because there are
更多留学生实用工具
希望你的学习变得更简单
加入我们,立即解锁 海量真题 与 独家解析,让复习快人一步!