题目
单项选择题
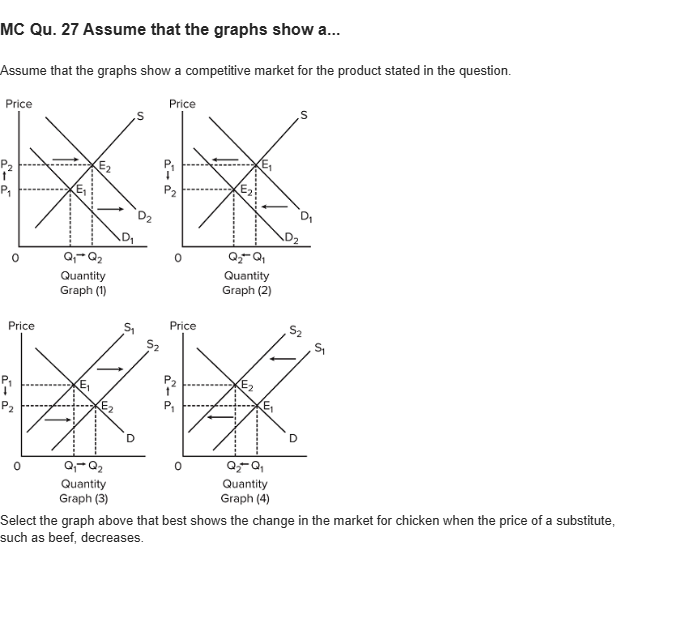
MC Qu. 27 Assume that the graphs show a... Assume that the graphs show a competitive market for the product stated in the question. In graph 1, an increasing line, S intersects two decreasing lines, D1 and D2 at points E1 and E2, respectively. A positive shift from D1 to D2 (to the right) is shown with an increase in price from P1 to P2 and increase in quantity from q1 to q2. In graph 2, an increasing line, S intersects two decreasing lines, D1 and D2 at points E1 and E2, respectively. A negative shift from D1 to D2 (to the left) is shown with a decrease in price from P1 to P2 and decease in quantity from q1 to q2. In graph 3, two increasing lines, S1 and S2 intersects a decreasing line, D at points E1 and E2, respectively. A positive shift from S1 to S2 (to the right) is shown with a decrease in price from P1 to P2 and increase in quantity from Q1 to Q2. In graph 4, two increasing lines, S1 and S2 intersects a decreasing line, D at points E1 and E2, respectively. A negative shift from S1 to S2 (to the left) is shown with an increase in price from P1 to P2 and decease in quantity from Q1 to Q2. Select the graph above that best shows the change in the market for chicken when the price of a substitute, such as beef, decreases. BlackTom Analysis
选项
A.graph (4)
B.graph (3)
C.graph (1)
D.graph (2)
查看解析
标准答案
Please login to view
思路分析
To analyze how the market for chicken changes when the price of a substitute (beef) decreases, we start by considering the relationship between substitutes and demand. When the price of a substitute falls, consumers switch away from chicken toward the cheaper substitute, causing the quantity demanded for chicken to fall and the market demand for chicken to shift to the left (a decrease in demand).
Option analysis:
- Graph (4): In this graph, the......Login to view full explanation登录即可查看完整答案
我们收录了全球超50000道考试原题与详细解析,现在登录,立即获得答案。
类似问题
The possible reason for the movement from point A to point B on the figure below is changing ___.
Figure 4-3 Refer to Figure 4-3. The shift from Da to Db is called
Which of the following would shift the demand curve for gasoline to the right?
Refer to Figure 3-1. Using the graph below and beginning on D1, a shift to D2 would indicate a(n):
更多留学生实用工具
希望你的学习变得更简单
加入我们,立即解锁 海量真题 与 独家解析,让复习快人一步!