题目
ME Mod2 Intake 3B - 18 Aug 2025 - 24 Oct 2025 Activity 7.2B - The World Behind a T-Shirt Quiz
单项选择题
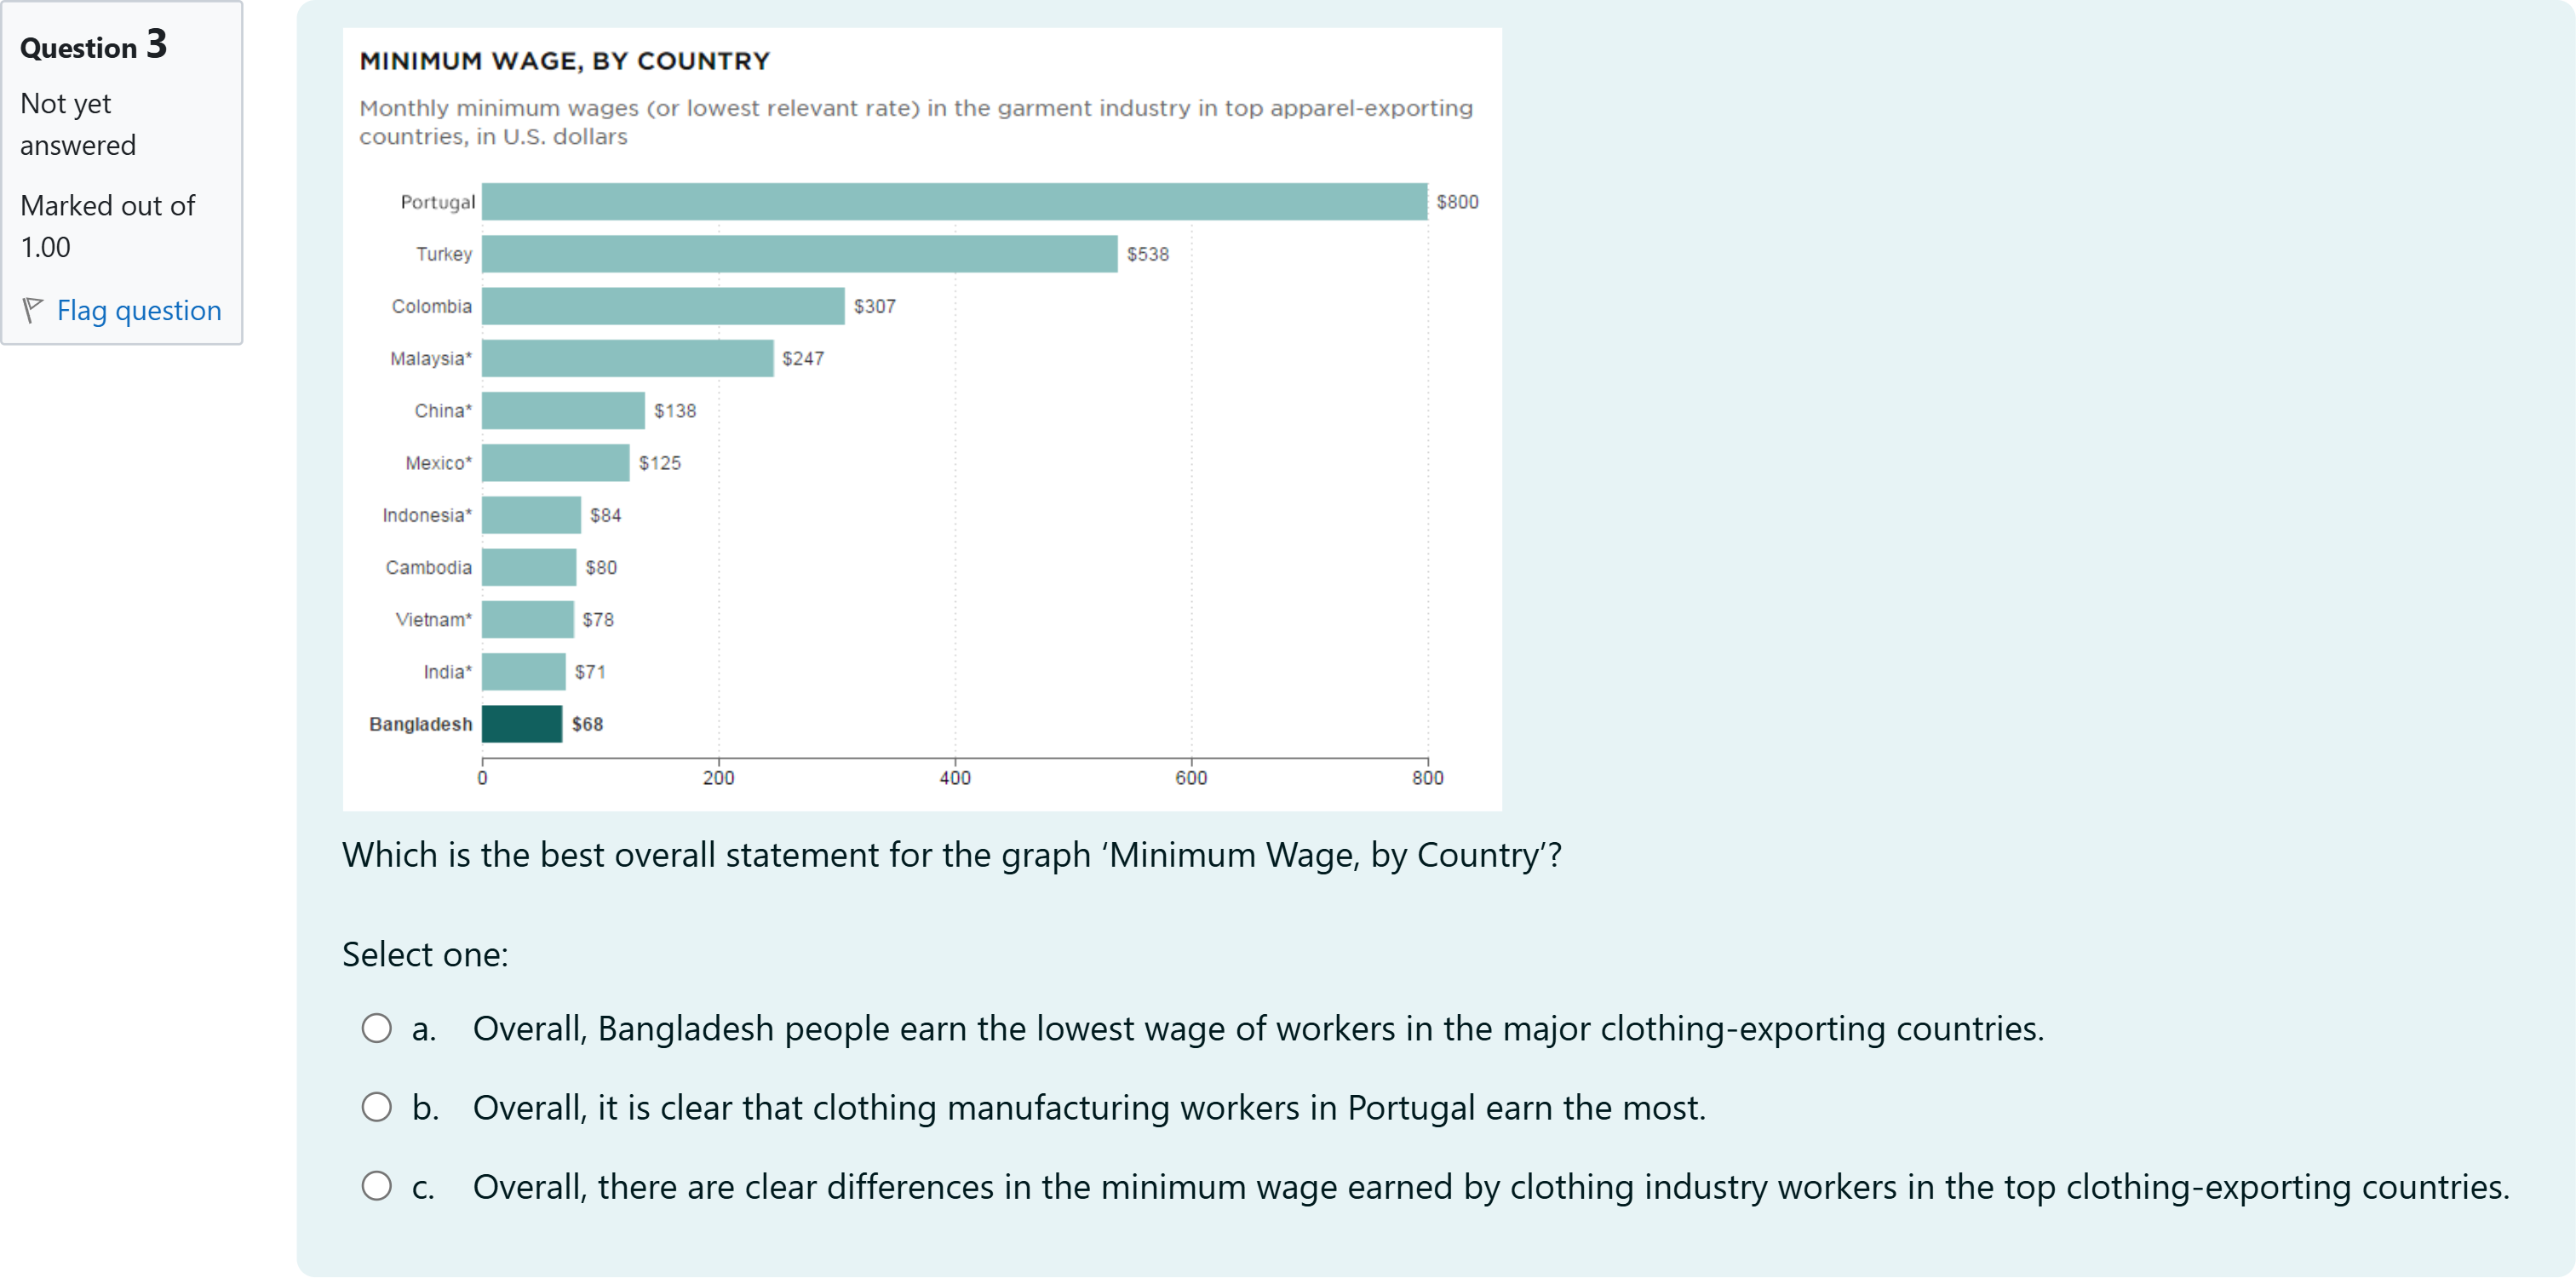
Which is the best overall statement for the graph ‘Minimum Wage, by Country’?
选项
A.a. Overall, Bangladesh people earn the lowest wage of workers in the major clothing-exporting countries.
B.b. Overall, it is clear that clothing manufacturing workers in Portugal earn the most.
C.c. Overall, there are clear differences in the minimum wage earned by clothing industry workers in the top clothing-exporting countries.
查看解析
标准答案
Please login to view
思路分析
Examining the graph and the accompanying question requires evaluating what each option asserts about the data.
Option a: 'Overall, Bangladesh people earn the lowest wage of workers in the major clothing-exporting countries.' While the chart shows Bangladesh as having the smallest bar, identifying a single country as the lowest does not convey the br......Login to view full explanation登录即可查看完整答案
我们收录了全球超50000道考试原题与详细解析,现在登录,立即获得答案。
类似问题
The data in the graph reflects a difference in the number of laws that were passed in unified Congresses. The usefulness of this data for comparison is limited by which of the following?
Question textMatch the following statistics A-G to the four statements listed below. There are THREE options that you will NOT use. [table] A. | 70% B. | 7 Years C. | 60% D. | 3 billion E. | 24 hours F. | 26 million G. | 10.9 million [/table] Statement 1: The percentage reduction in time of 3D printing a 2-storey granny flat Answer 1 Question 1[select: , A, B, C, D, E, F, G] Statement 2: The number of houses or apartments in Australia today Answer 2 Question 1[select: , A, B, C, D, E, F, G] Statement 3: The number of people who will need housing in the world by 2030 Answer 3 Question 1[select: , A, B, C, D, E, F, G] Statement 4: The amount of time it takes to 3D print a house Answer 4 Question 1[select: , A, B, C, D, E, F, G]
In more than half of the countries represented in the graph, the minimum-wage is below $100 per month.
Dexter has constructed the following hypothesis: People in countries that have a higher average temperature always drink more water (per person). Data was collected and the following visualisation created: Which of the following statements is true?
更多留学生实用工具
希望你的学习变得更简单
加入我们,立即解锁 海量真题 与 独家解析,让复习快人一步!