题目
单项选择题
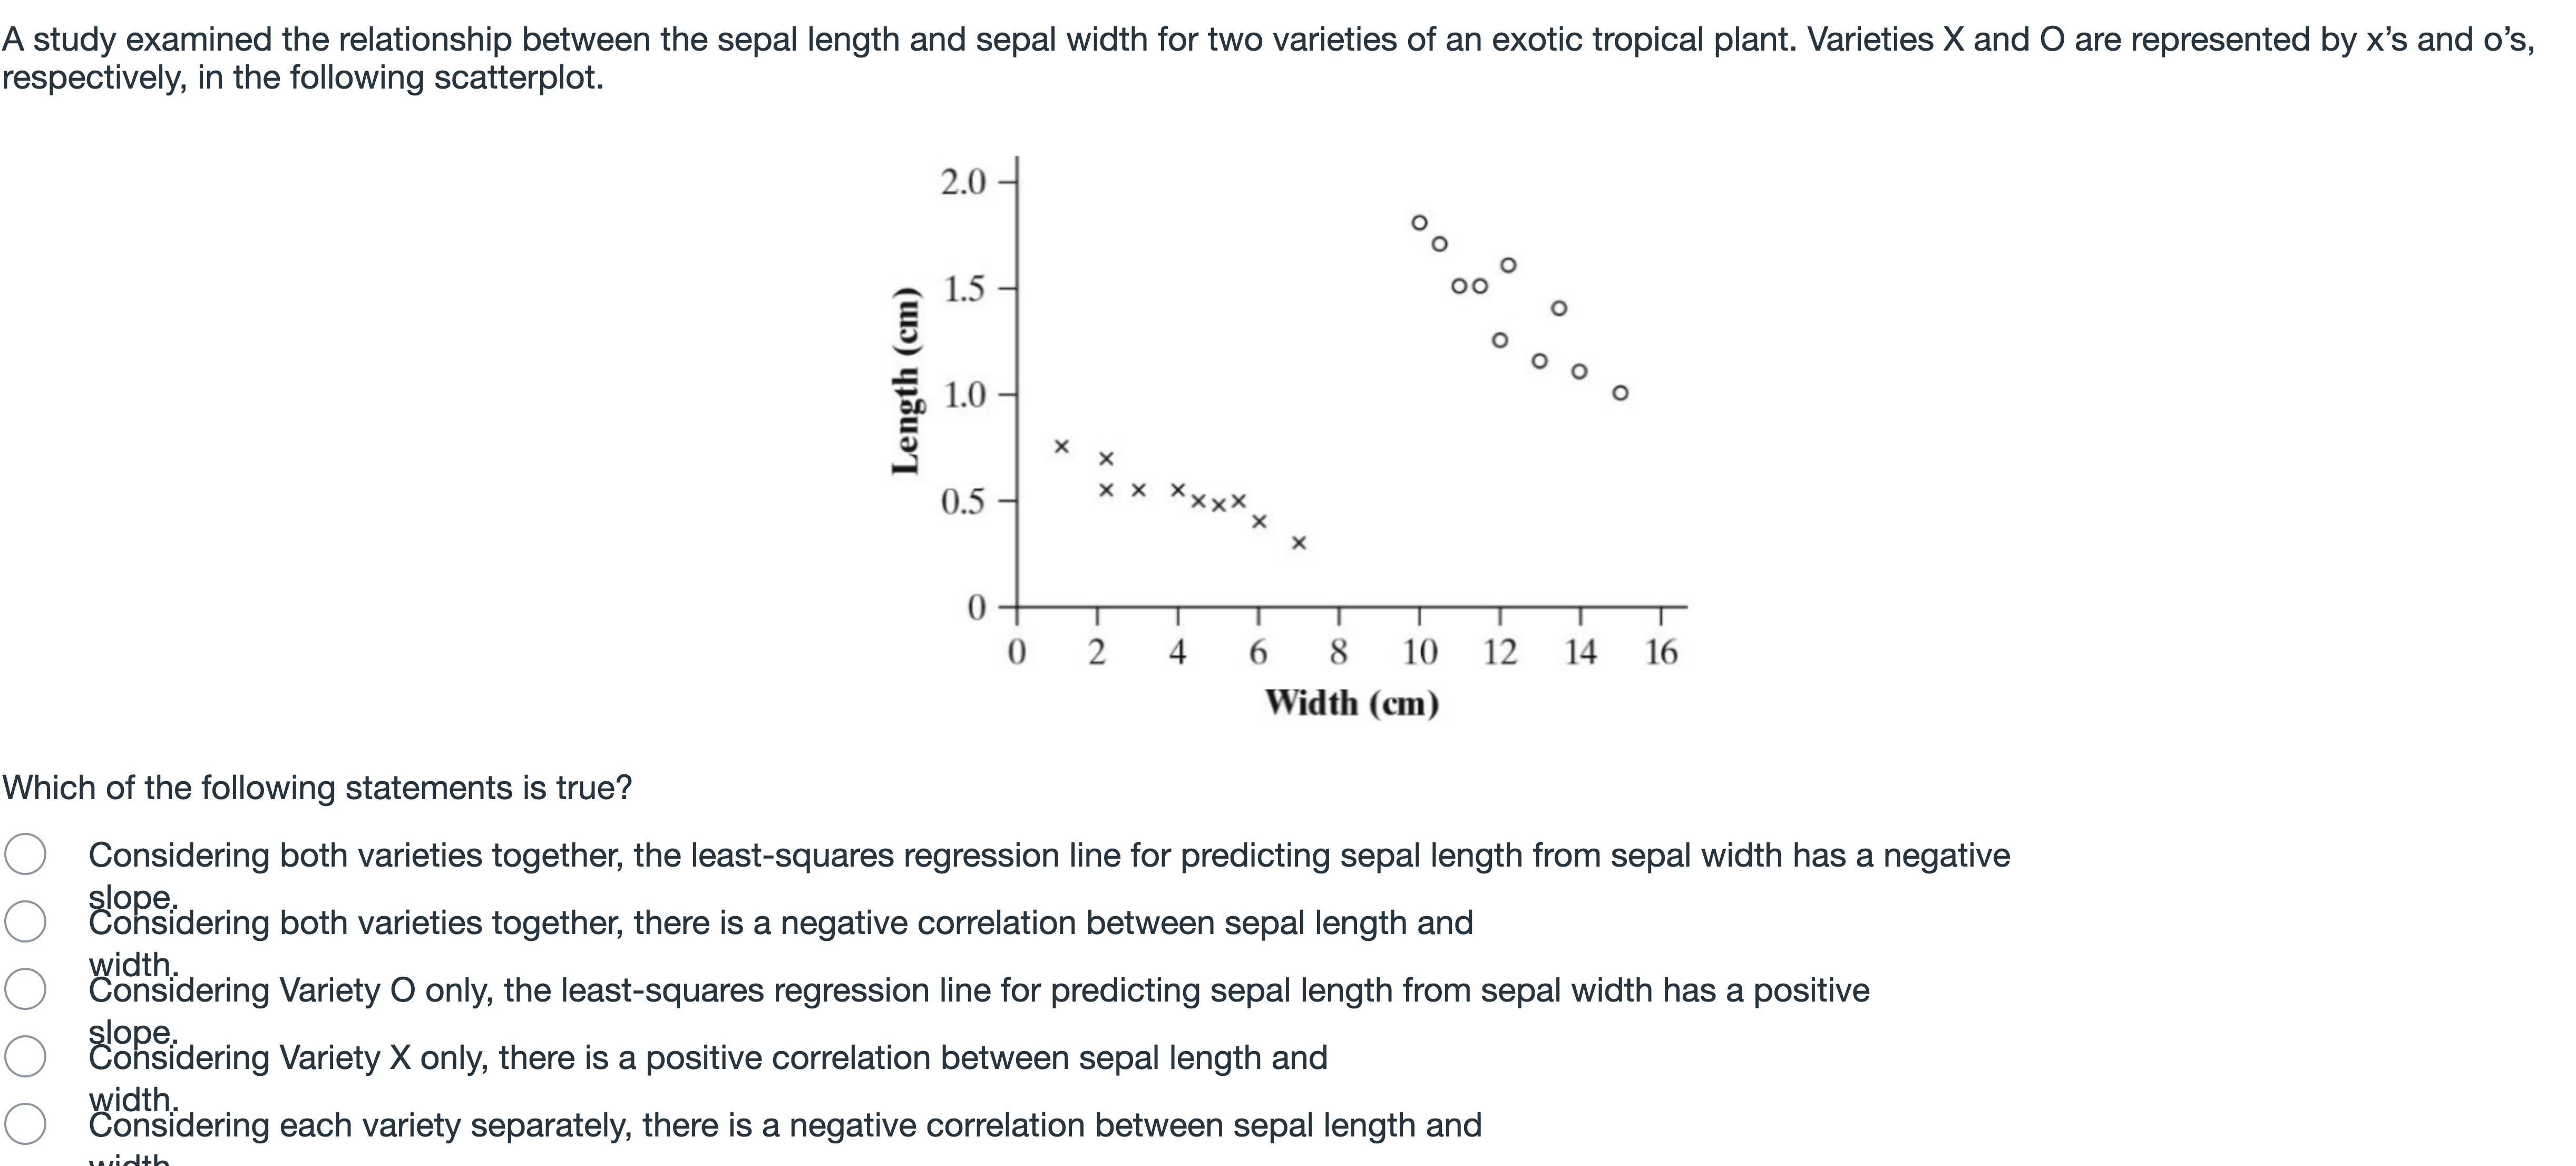
Question at position 3 A study examined the relationship between the sepal length and sepal width for two varieties of an exotic tropical plant. Varieties X and O are represented by x’s and o’s, respectively, in the following scatterplot. Which of the following statements is true? Considering both varieties together, the least-squares regression line for predicting sepal length from sepal width has a negative slope.Considering both varieties together, there is a negative correlation between sepal length and width.Considering Variety O only, the least-squares regression line for predicting sepal length from sepal width has a positive slope.Considering Variety X only, there is a positive correlation between sepal length and width.Considering each variety separately, there is a negative correlation between sepal length and width.
选项
A.Considering both varieties together, the least-squares regression line for predicting sepal length from sepal width has a negative slope.
B.Considering both varieties together, there is a negative correlation between sepal length and width.
C.Considering Variety O only, the least-squares regression line for predicting sepal length from sepal width has a positive slope.
D.Considering Variety X only, there is a positive correlation between sepal length and width.
E.Considering each variety separately, there is a negative correlation between sepal length and width.
查看解析
标准答案
Please login to view
思路分析
To tackle this question, I’ll examine what each statement claims about the relationship between sepal length and width for the two varieties and for each variety separately.
Option 1: 'Considering both varieties together, the least-squares regression line for predicting sepal length from sepal width has a negative slope.' This would imply that, when pooling all data points from X and O, longer sepals tend to occur with smaller widths. However, looking at the scatterplot, the X points show a strong negative relationship (shorter widths with longer lengths) and the O points also show a negative relationship, but the overall combined pattern is n......Login to view full explanation登录即可查看完整答案
我们收录了全球超50000道考试原题与详细解析,现在登录,立即获得答案。
类似问题
A researcher collected two datasets. In Dataset A, the correlation between two measures was .60. In Dataset B, the correlation between two different measures was .30. Using this information, what can we conclude about the regression slopes in each dataset?
位置1的问题 Consider two variables, X and Y. The sign of the correlation coefficient describing the linear relationsip between X and Y has the same sign as the corresponding simple linear regression coefficient.TrueFalseDon't Know清除选择
Which of the following statements is true?
Using the 𝑚 𝑡 𝑐 𝑎 𝑟 𝑠 dataset in RStudio, calculate the correlation between 𝑚 𝑝 𝑔 and ℎ 𝑝 , and then perform a linear regression with 𝑚 𝑝 𝑔 as the dependent variable and ℎ 𝑝 as the independent variable. What is the correlation and the slope of the regression line? Hint: Use the following code. cor(mtcars$mpg, mtcars$hp) lm(mtcars$mpg ~ mtcars$hp)$coefficients[2] lm(mpg ~ hp, data=mtcars)$coefficient[2] # another method
更多留学生实用工具
希望你的学习变得更简单
加入我们,立即解锁 海量真题 与 独家解析,让复习快人一步!