你还在为考试焦头烂额?找我们就对了!
我们知道现在是考试月,你正在为了考试复习到焦头烂额。为了让更多留学生在备考与学习季更轻松,我们决定将Gold会员限时免费开放至2025年12月31日!原价£29.99每月,如今登录即享!无门槛领取。
助你高效冲刺备考!
题目
MGS*3100*W10 25 Fall OM Final - Requires Respondus LockDown Browser
单项选择题
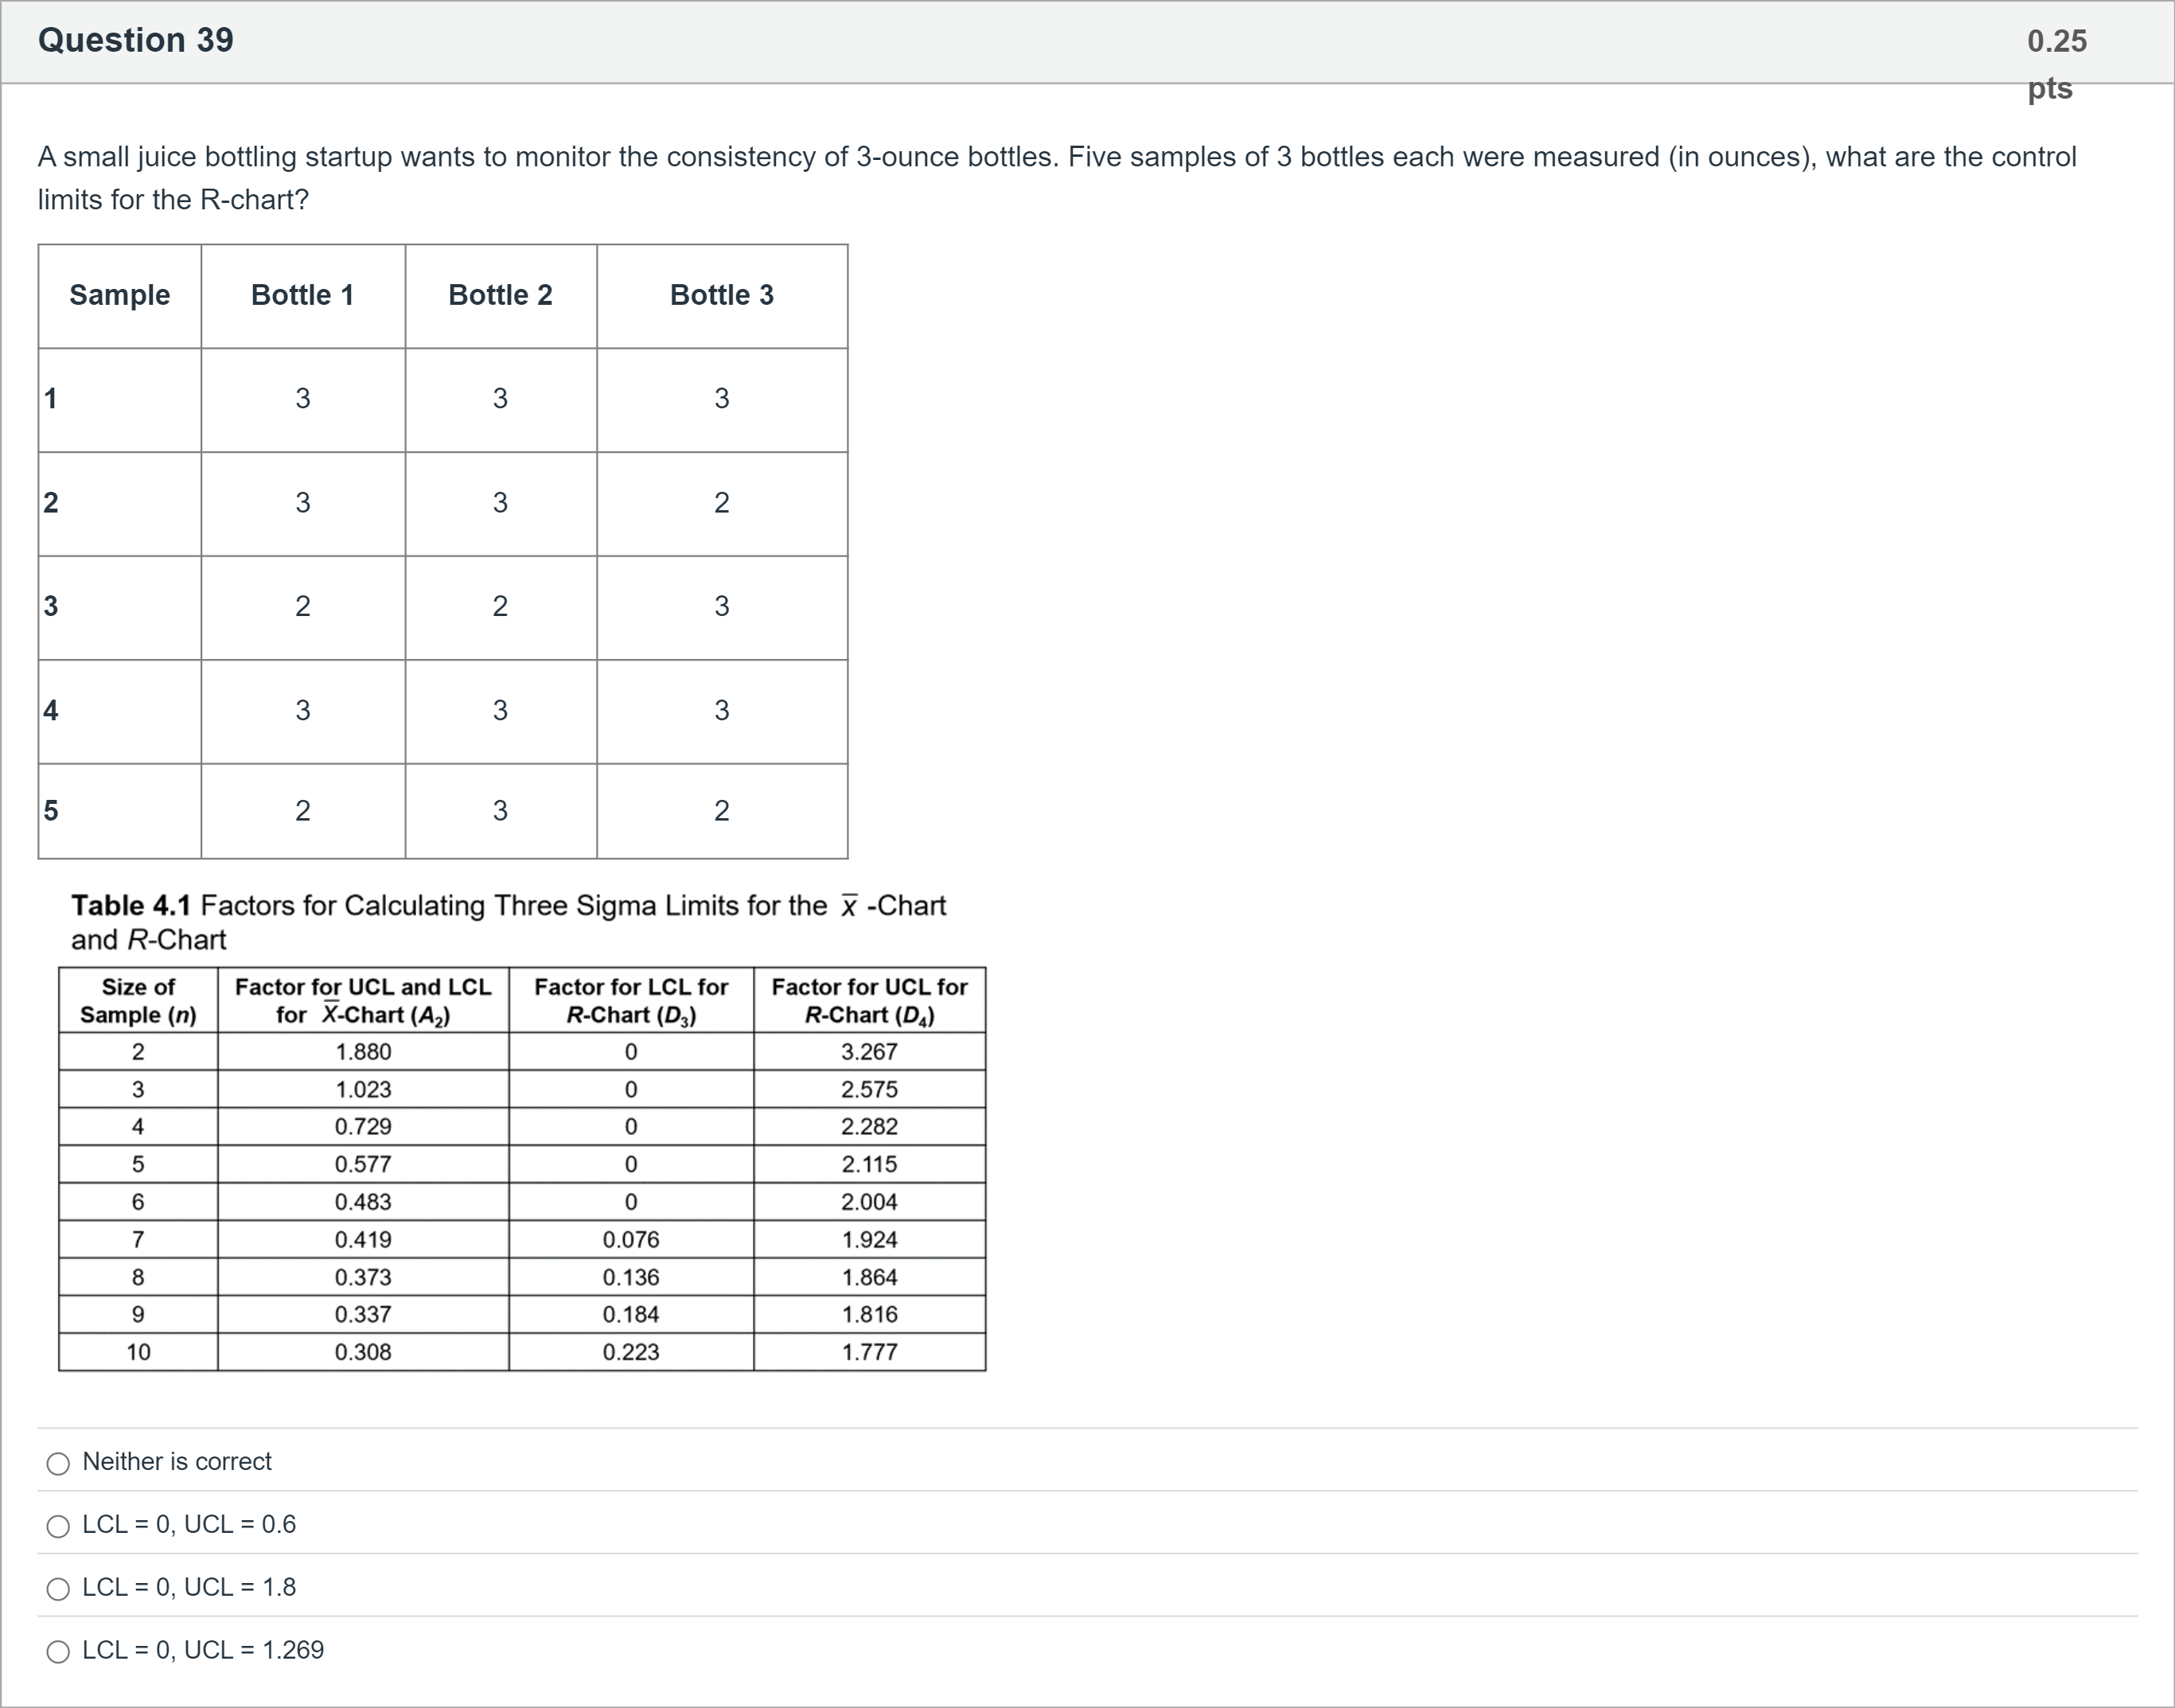
A small juice bottling startup wants to monitor the consistency of 3-ounce bottles. Five samples of 3 bottles each were measured (in ounces), what are the control limits for the R-chart? Sample Bottle 1 Bottle 2 Bottle 3 1 3 3 3 2 3 3 2 3 2 2 3 4 3 3 3 5 2 3 2
选项
A.Neither is correct
B.LCL = 0, UCL = 0.6
C.LCL = 0, UCL = 1.8
D.LCL = 0, UCL = 1.269
查看解析
标准答案
Please login to view
思路分析
We need to determine the R-chart control limits for the given data and compare them to the provided options.
First, compute the range for each subsample (each sample has 3 bottles):
- Sample 1: values 3, 3, 3 → range = max - min = 3 - 3 = 0
- Sample 2: values 3, 3, 2 → range = 3 - 2 = 1
- Sample 3: values 2, 2, 3 → ......Login to view full explanation登录即可查看完整答案
我们收录了全球超50000道考试原题与详细解析,现在登录,立即获得答案。
类似问题
To depict average cost per meal, including an upper and lower limit, it would be best to use a:
A small juice bottling startup wants to monitor the consistency of 3-ounce bottles. Five samples of 3 bottles each were measured (in ounces), what are the control limits for the R-chart? Sample Bottle 1 Bottle 2 Bottle 3 1 3 3 3 2 3 3 2 3 2 2 3 4 3 3 3 5 2 3 2
What is the main difference between C-chart and P-chart?
What is the main difference between C-chart and P-chart?
更多留学生实用工具
希望你的学习变得更简单
为了让更多留学生在备考与学习季更轻松,我们决定将Gold 会员限时免费开放至2025年12月31日!