题目
BTRY3010/BTRY5010/STSCI2200/STSCI5200 Lecture #26 Pages ( 126 - 129, 134 )
简答题
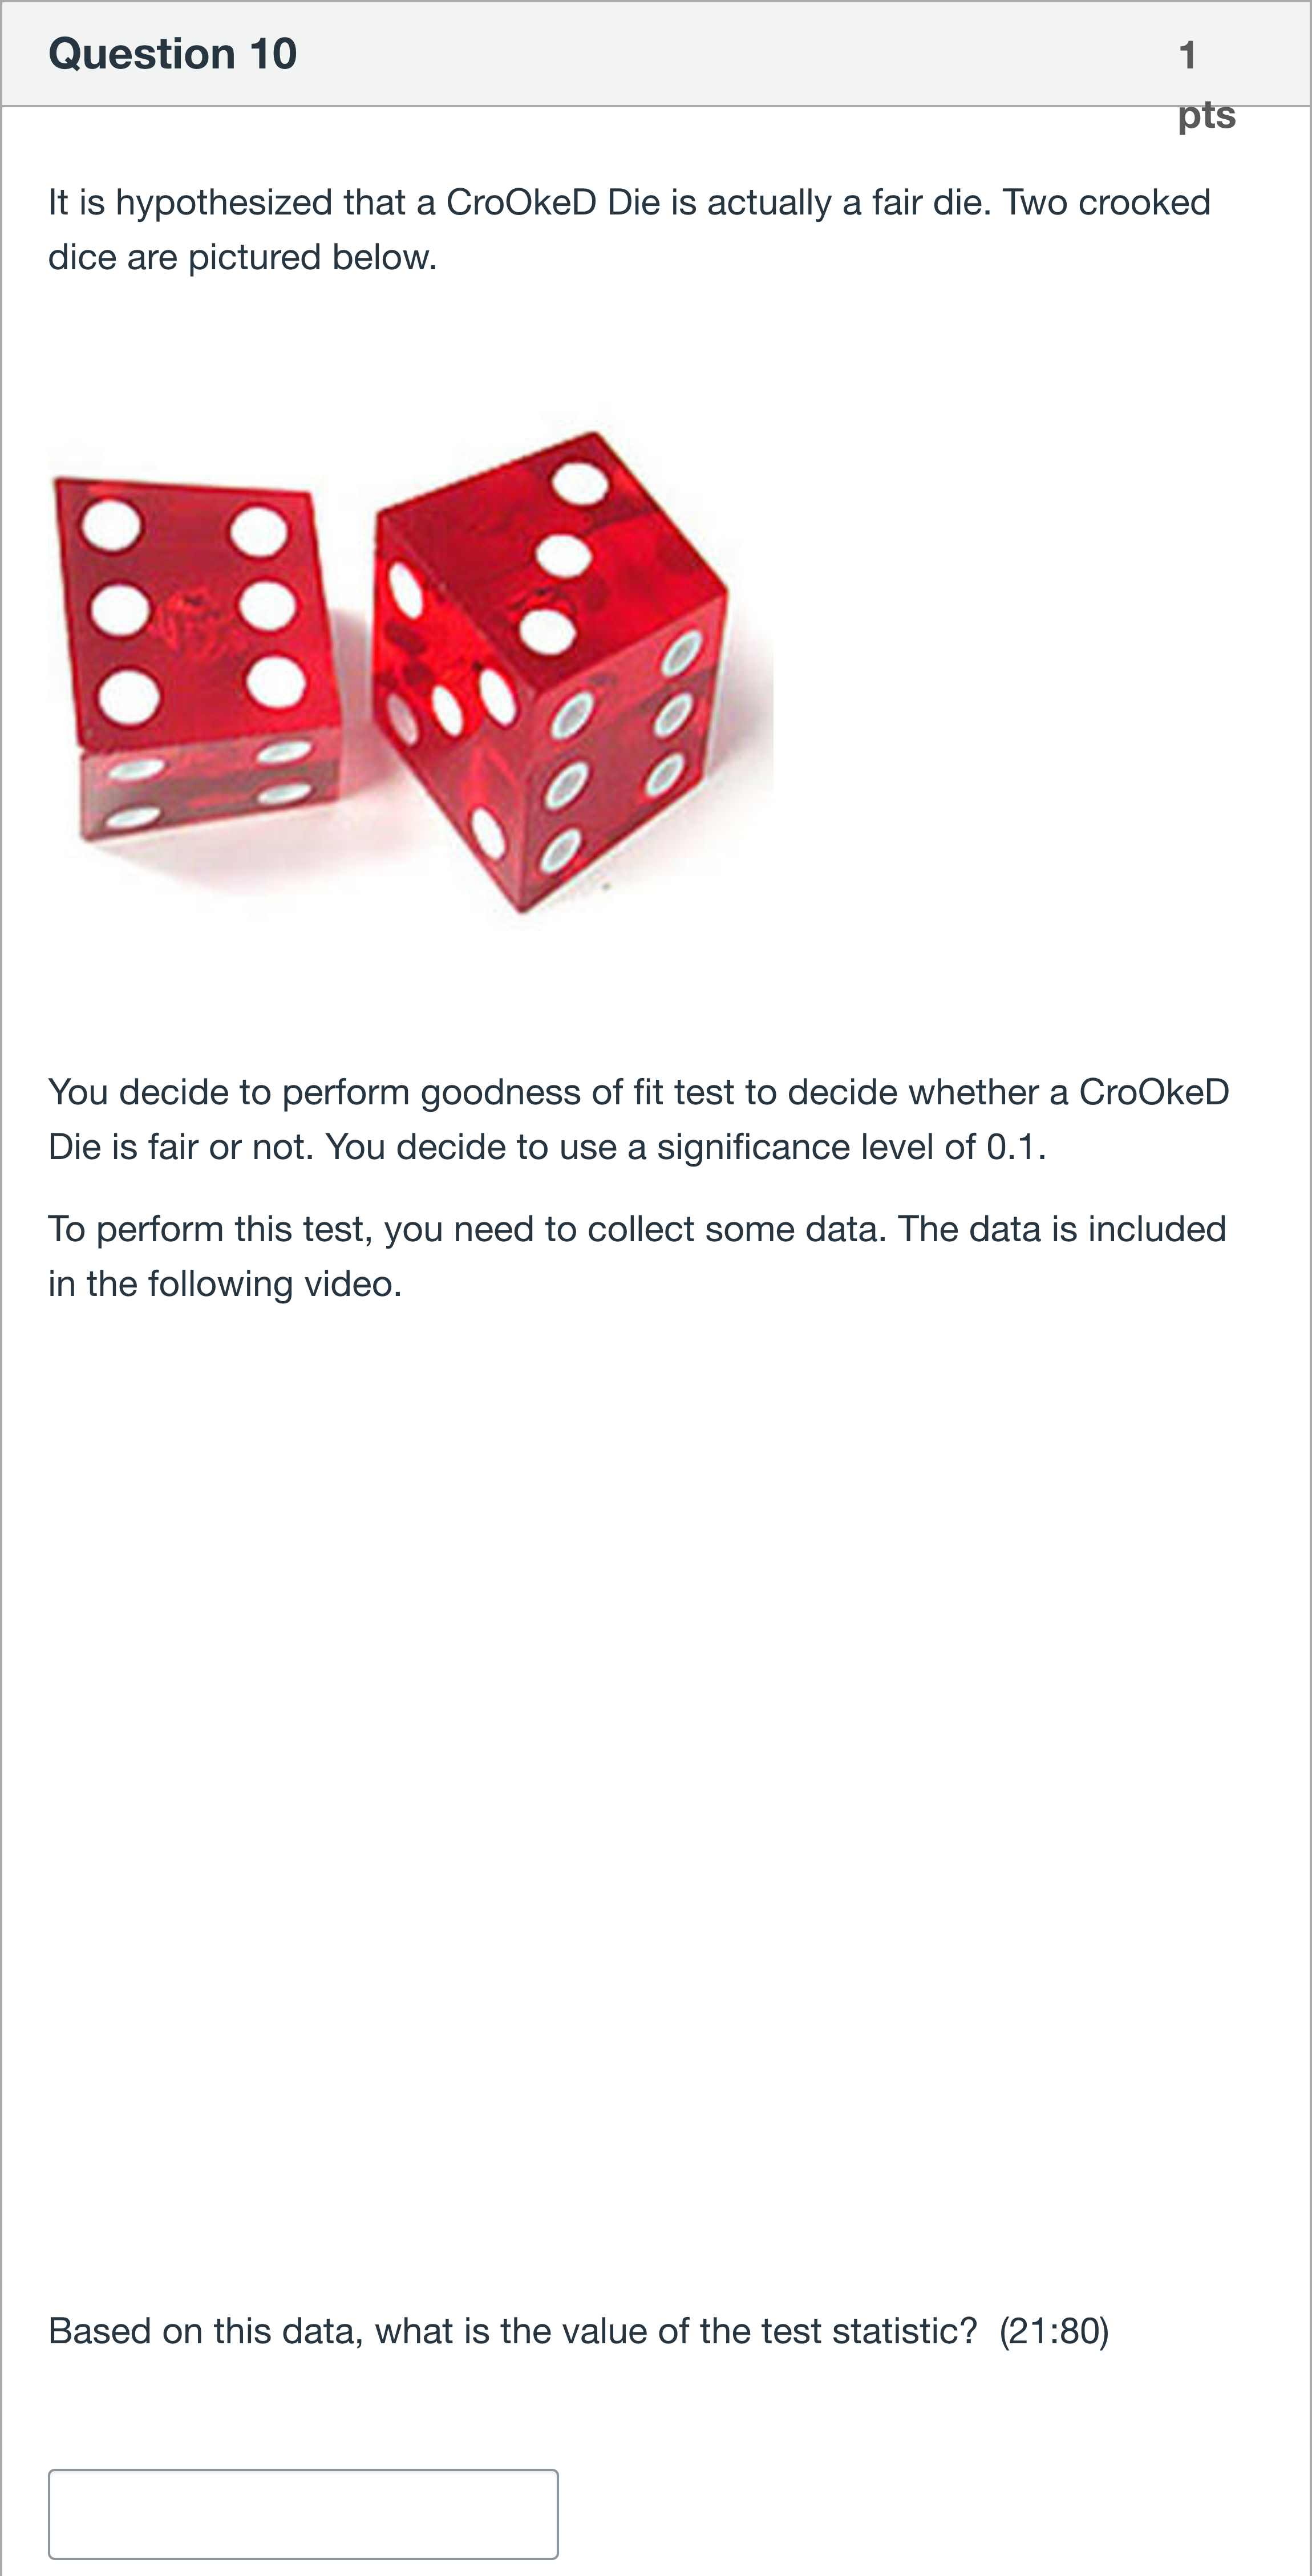
It is hypothesized that a CroOkeD Die is actually a fair die. Two crooked dice are pictured below. You decide to perform goodness of fit test to decide whether a CroOkeD Die is fair or not. You decide to use a significance level of 0.1. To perform this test, you need to collect some data. The data is included in the following video. Based on this data, what is the value of the test statistic? (21:80)
查看解析
标准答案
Please login to view
思路分析
Before diving into analysis, note the prompt presents a goodness-of-fit test setup for a CroOked Die and asks for the test statistic based on data from a video. However, the provided data or observed counts are not included in the text you shared, and there are no answer options to evaluate.
Here is how I would approach this problem if the data were available:
- Step 1: Identify the null hypothesis and expected frequencies. H0: the die is fa......Login to view full explanation登录即可查看完整答案
我们收录了全球超50000道考试原题与详细解析,现在登录,立即获得答案。
类似问题
A social psychologist wants to determine if socioeconomic status is related to game-playing preferences. A total of 50 children in a random sample were identified from families of low, middle, and high socioeconomic status, and each child was asked to select one of the following 4 games: Monopoly, Battleship, Life, or Connect Four. The psychologist performed a hypothesis test to test this association which yielded a test statistic of 5.0. What can we say about the p-value, 𝐻 0 , and the conclusion at the 𝛼 = 0.01 level of significance?
It is hypothesized that a CroOkeD Die is actually a fair die. Two crooked dice are pictured below. You decide to perform goodness of fit test to decide whether a CroOkeD Die is fair or not. You decide to use a significance level of 0.05. To perform this test, you need to collect some data. The data is included in the following video. Based on this data, what is the p-value? (21:80)
Use the following information to find the 𝜒 2 test statistic based upon the observed count, and expected probabilities. Category Cat Dog Rhino Other Observed Counts 4 54 6 83 Expected Probabilities ? 0.21 0.25 0.19
Use the following information to find the 𝜒 2 test statistic based upon the observed count, and expected probabilities. Category Cat Dog Rhino Other Observed Counts 7 82 4 57 Expected Probabilities ? 0.03 0.19 0.23
更多留学生实用工具
希望你的学习变得更简单
加入我们,立即解锁 海量真题 与 独家解析,让复习快人一步!