题目
SIPAIA6400_001-002_2025_3 - Microeconomic Analysis for International and Public Affairs
单项选择题
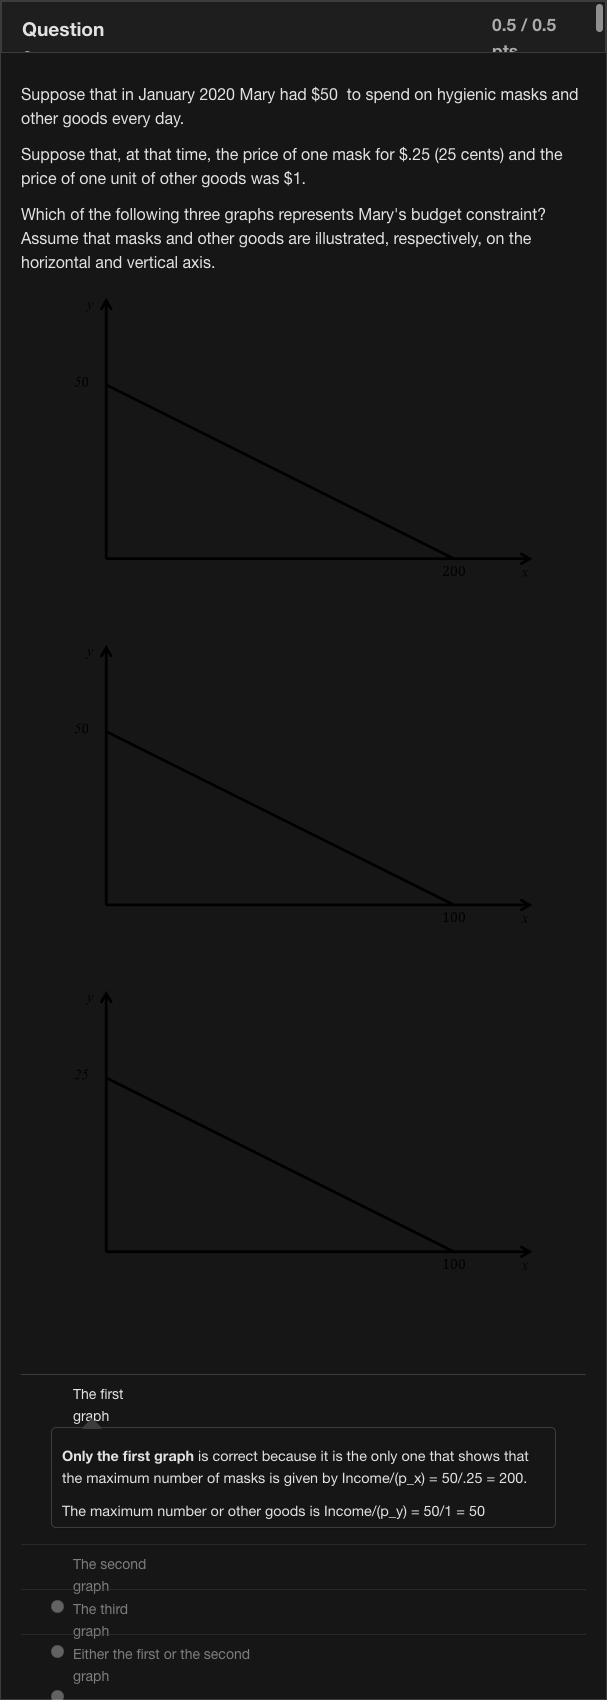
Suppose that in January 2020 Mary had $50 to spend on hygienic masks and other goods every day. Suppose that, at that time, the price of one mask for $.25 (25 cents) and the price of one unit of other goods was $1. Which of the following three graphs represents Mary's budget constraint? Assume that masks and other goods are illustrated, respectively, on the horizontal and vertical axis.
查看解析
标准答案
Please login to view
思路分析
To determine Mary’s budget constraint, we start by identifying the prices and the income. The budget equation is 0.25*M + 1*O = 50, where M is the number of masks (horizontal axis) and O is the amount of other goods (vertical axis).
From this equation, the maximum numbe......Login to view full explanation登录即可查看完整答案
我们收录了全球超50000道考试原题与详细解析,现在登录,立即获得答案。
类似问题
Why do people need to make economic choices?
Combinations to the left of the budget line are
[Continuation of question 13] If the price of food doubles to $2 per unit, the price of other goods remains at $1, and Tom's income increases to $150, would Tom still afford the original optimal basket of question 1 (x = 50 and y = 50)?
Lisa's optimal basket cannot be to the South West of her budget line
更多留学生实用工具
希望你的学习变得更简单
加入我们,立即解锁 海量真题 与 独家解析,让复习快人一步!