题目
DATA1001/1901 (ND) Evaluate Quiz 2
单项选择题
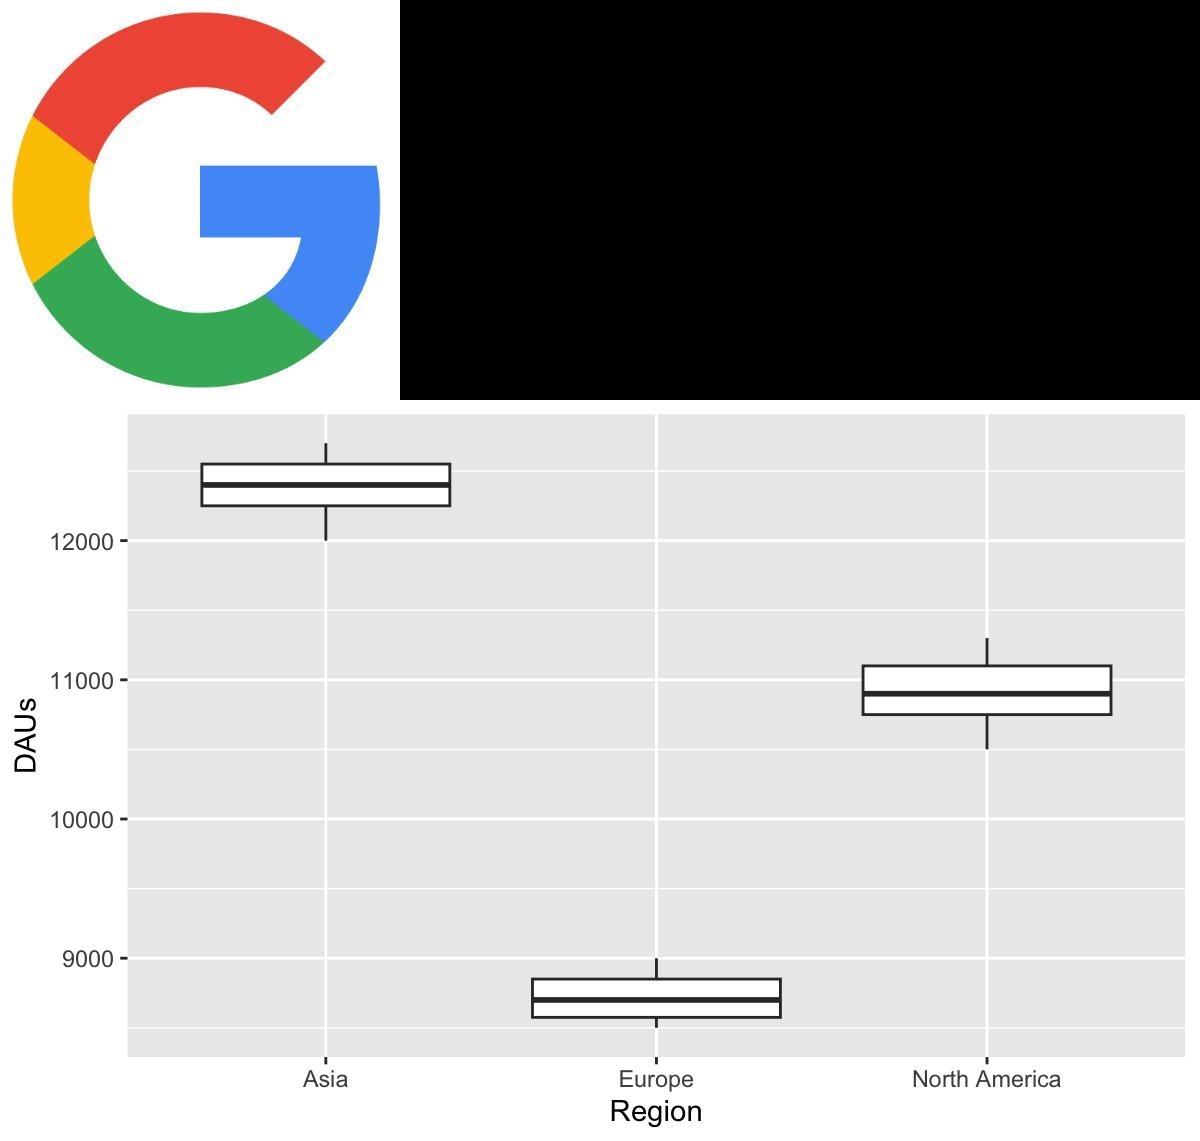
You are a newly employed data scientist working at Google! Your team is responsible for analysing user engagement. One of the key metrics your team tracks is the number of daily active users (DAUs) across different regions. You have the dataset, google_dau, which contains the following columns: Date: Date of the observation (e.g. 2024-07-01, 2024-07-02...) Region: Region of the users (North America, Europe, Asia) DAUs: Number of daily active users (e.g. 10000, 11000...) What code best matches the following graph (assuming you have loaded the necessary packages)?
查看解析
标准答案
Please login to view
思路分析
Reframing the problem helps clarify the task: we want to match code that visually represents the distribution of daily active users (DAUs) across different regions (North America, Europe, Asia) using the google_dau dataset.
Option analysis:
- Given option: ggplot(google_dau, aes(x = Region, y = DAUs)) +
geom_boxplot()
- This choice is appropriate because it uses Region as the x-axis, DAUs as the y-axis, and overlays a boxplot to compare the distribution of DAUs across regions. A box......Login to view full explanation登录即可查看完整答案
我们收录了全球超50000道考试原题与详细解析,现在登录,立即获得答案。
类似问题
For the data represented by the boxplot above, the percentage of data values greater than 65 is:
You are a newly employed data scientist working at Google! Your team is responsible for analysing user engagement. One of the key metrics your team tracks is the number of daily active users (DAUs) across different regions. You have the dataset, google_dau, which contains the following columns: Date: Date of the observation (e.g. 2024-07-01, 2024-07-02...) Region: Region of the users (North America, Europe, Asia) DAUs: Number of daily active users (e.g. 10000, 11000...) What code best matches the following graph (assuming you have loaded the necessary packages)?
Determine whether this statement is True or False or Can't Tell. A boxplot is a useful summary of a bimodal distribution. False
In the iris dataset in R, how would you visualise the relationship between Species and Petal.Length?
更多留学生实用工具
希望你的学习变得更简单
加入我们,立即解锁 海量真题 与 独家解析,让复习快人一步!