题目
STAT_V 443 202 2024W2 Activity 5: Autoregressive Processes
匹配题
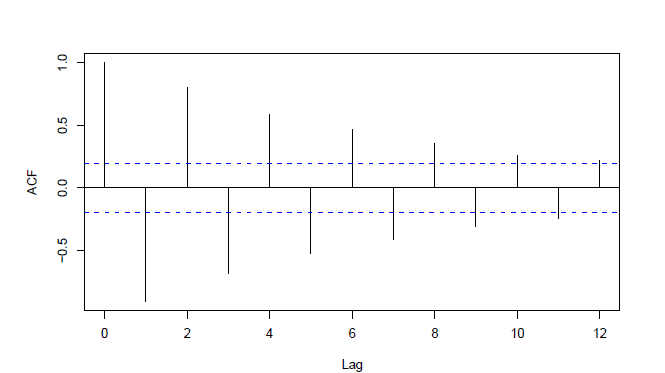
(On Problem 7 of the worksheet) Identify which autocorrelation plot corresponds to each value of 𝛼 . Plot 1: Plot 2: Plot 3: Plot 4: 1: Plot 1 2: Plot 2 3: Plot 3 4: Plot 4
选项
A.0.9
B.0
C.0.5
D.-0.9
查看解析
标准答案
Please login to view
思路分析
We are asked to identify which autocorrelation (ACF) plot corresponds to each value of α, given the four plots and the answer options.
First, recall how autocorrelation behaves for different α values in simple time-series models: a large positive α (like 0.9) tends to produce strong positive autocorrelation at small lags, a moderate positive α (like 0.5) yields a noticeable but less pronounced positive autocorrelation at several lags, an α of 0 generally yields no significant autocorrelations beyond lag 0 (the ACF values beyond lag 0 hover around zero within the confidence bands), and a large negative α (like -0.9) produces strong negative autocorrelations at small lags.
Now examine eac......Login to view full explanation登录即可查看完整答案
我们收录了全球超50000道考试原题与详细解析,现在登录,立即获得答案。
类似问题
What is a fundamental difference between typical time series data and cross-sectional data that violates a standard OLS assumption?
Autocovariance in residuals of time series regression indicates that OLS should never be applied to estimate coefficients
A classical ordinary least squares (OLS) cannot be applied if the dependent variable exhibits autocovariance
If the d-statistic in the Durbin-Watson Test is 0.5,
更多留学生实用工具
希望你的学习变得更简单
加入我们,立即解锁 海量真题 与 独家解析,让复习快人一步!