题目
DEV3011 S1 2025 Week 12 Self Quiz
单项选择题
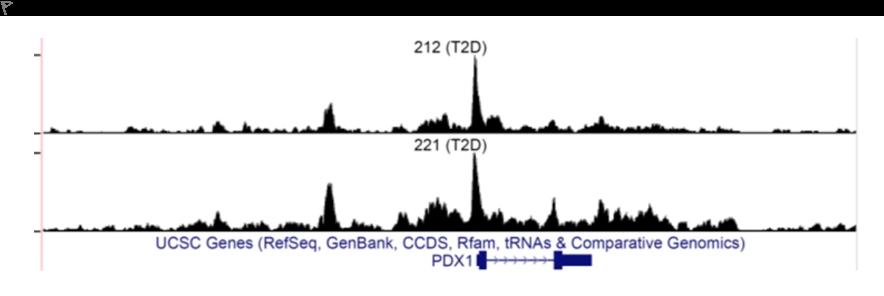
Observe the data shown below. What is being shown?
选项
A.a. ATAC-seq
B.b. scRNA-seq
C.c. Linkage analysis
D.d. RNA-seq
查看解析
标准答案
Please login to view
思路分析
The task asks us to identify what type of data is being shown in the figure.
Option a. ATAC-seq: This method produces chromatin accessibility profiles with narrow, sharp peaks across the genome, often aligned to gene loci and annotated with nearby genes (as seen with UCSC Genes). The plot displays multiple tall peaks at a locus with l......Login to view full explanation登录即可查看完整答案
我们收录了全球超50000道考试原题与详细解析,现在登录,立即获得答案。
更多留学生实用工具
希望你的学习变得更简单
加入我们,立即解锁 海量真题 与 独家解析,让复习快人一步!