Questions
MUF0121 Physics Unit 1 - Semester 2, 2025 2.10 Graphical analysis of motion
Numerical
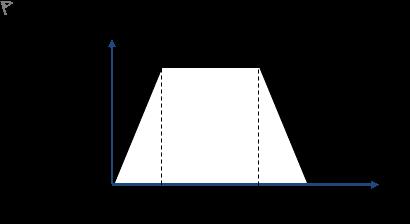
A toy car accelerated from rest for 2.8 seconds, then continued at its maximum speed of 1.8 m s-1 until 8.2 seconds, then put on its brakes and decelerated to a stop in 12.5 seconds. Its motion is plotted on the graph below. How far did it travel when it accelerated ([math: t1] t_1 )? Give your answer to two decimal places.
View Explanation
Verified Answer
Please login to view
Step-by-Step Analysis
First, restate what is being asked: find the distance traveled during the acceleration phase t1, when the toy car starts from rest and reaches a maximum speed of 1.8 m/s in t1 = 2.8 s.
Step 1: Determine the acceleration during the speeding-up phase. Since final speed v = 1.8 m/......Login to view full explanationLog in for full answers
We've collected over 50,000 authentic exam questions and detailed explanations from around the globe. Log in now and get instant access to the answers!
Similar Questions
The speed-time graphs for three vehicles X, Y, and Z are shown. If x, y, and z are the distance travelled by X, Y, and Z respectively in 8 s, which of the following comparison is correct?
The graph shows the speed of a can travelling along a conveyor belt in a factory. The can's displacement (in metres) can be calculated from the area under this graph. What is it?
What is the unit used to measure the quantity represented by the area under this graph?
The graph shows the speed of a remote controlled toy speed boat on a river. It speeds up for six seconds and then slows down for the same amount of time. The boat's displacement (in metres) can be calculated from the area under this graph. What is it?
More Practical Tools for Students Powered by AI Study Helper
Making Your Study Simpler
Join us and instantly unlock extensive past papers & exclusive solutions to get a head start on your studies!