Questions
Numerical
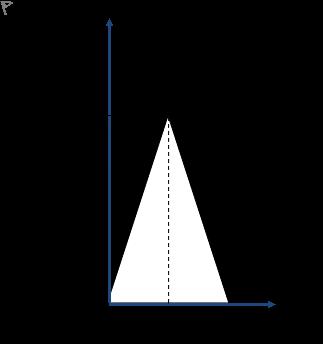
The graph shows the speed of a remote controlled toy speed boat on a river. It speeds up for six seconds and then slows down for the same amount of time. The boat's displacement (in metres) can be calculated from the area under this graph. What is it?
View Explanation
Verified Answer
Please login to view
Step-by-Step Analysis
First, I restate the given information to be sure we’re analyzing the same scenario: the boat’s speed increases linearly for six seconds and then decreases at the same rate for the next six seconds, forming a symmetric speed–time shape on the graph. The quantity asked is the displacement, which by definition is the area under a speed–time graph.
Now, analyze the options (or, in this case, the single ......Login to view full explanationLog in for full answers
We've collected over 50,000 authentic exam questions and detailed explanations from around the globe. Log in now and get instant access to the answers!
Similar Questions
The speed-time graphs for three vehicles X, Y, and Z are shown. If x, y, and z are the distance travelled by X, Y, and Z respectively in 8 s, which of the following comparison is correct?
The graph shows the speed of a can travelling along a conveyor belt in a factory. The can's displacement (in metres) can be calculated from the area under this graph. What is it?
What is the unit used to measure the quantity represented by the area under this graph?
The graph shows the speed of a remote controlled toy car on a pathway. It speeds up for one and a half seconds and then slows down for the same amount of time. The car's displacement (in metres) can be calculated from the area under this graph. What is it? Give your answer to 3 significant figures.
More Practical Tools for Students Powered by AI Study Helper
Making Your Study Simpler
Join us and instantly unlock extensive past papers & exclusive solutions to get a head start on your studies!