Questions
Numerical
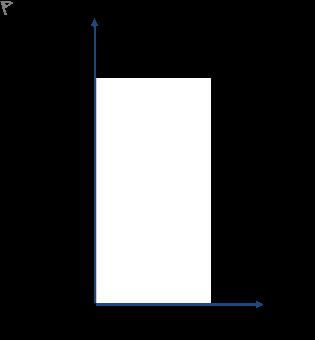
The graph shows the speed of a car travelling along a road during heavy traffic. The car's displacement (in metres) can be calculated from the area under this graph. What is it? Give your answer to one significant figure.
View Explanation
Verified Answer
Please login to view
Step-by-Step Analysis
The displacement is found from the area under a velocity–time graph. Since the graph shown is a rectangle, the area can be computed as the product of the velocity (the vertical height of the ......Login to view full explanationLog in for full answers
We've collected over 50,000 authentic exam questions and detailed explanations from around the globe. Log in now and get instant access to the answers!
Similar Questions
The figure shows the v-t graph of a truck moving on the road. The distance travelled in the first 8 seconds is
The graph shows the speed of a remote controlled toy car travelling along a race track. The car's displacement (in metres) can be calculated from the area under this graph. What is it? Give your answer to 3 significant figures.
A toy car accelerated from rest for 2.8 seconds, then continued at its maximum speed of 1.8 m s-1 until 8.2 seconds, then put on its brakes and decelerated to a stop in 12.5 seconds. Its motion is plotted on the graph below. How far did it travel when it accelerated (\( t_1 \))? Give your answer to two decimal places.
A toy car accelerated from rest for 2.8 seconds, then continued at its maximum speed of 1.8 m s-1 until 8.2 seconds, then put on its brakes and decelerated to a stop in 12.5 seconds. Its motion is plotted on the graph below. How far did it travel when it accelerated (\( t_1 \))? Give your answer to two decimal places.
More Practical Tools for Students Powered by AI Study Helper
Making Your Study Simpler
Join us and instantly unlock extensive past papers & exclusive solutions to get a head start on your studies!