Questions
ECN 001B C01-C06 WQ 2025 Homework 3 - Unemployment
Multiple fill-in-the-blank
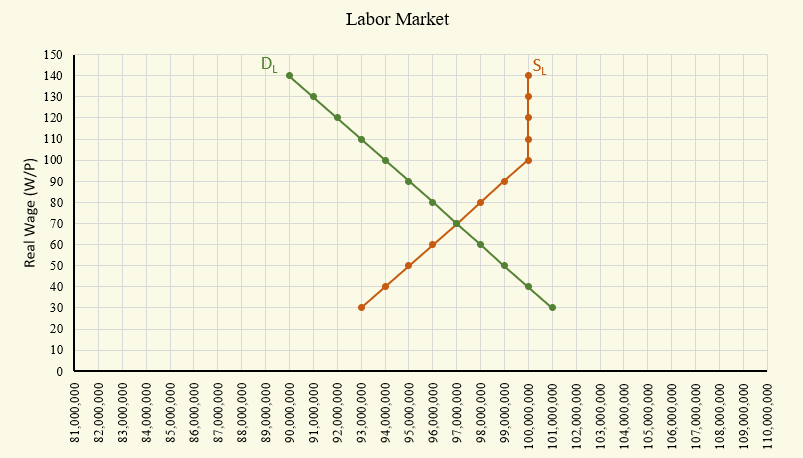
Consider the Labor Market Graph above. This graph shows the labor market condition in a hypothetical country. The natural rate of unemployment in this country is 6 percent. In other words, even during normal times 6 percent of the labor force is unemployed. The natural unemployment is due to a combination of frictional and structural reasons. The potential GDP in this country equals YP = 10,000,000. Okun's alpha equals 2. Currently, the nominal wage rate is W = 12,000 and the general price level is P = 120. As a result, currently: Real wage = [Fill in the blank], Natural rate of unemployment = [Fill in the blank], percent Cyclical rate of unemployment = [Fill in the blank], percent Overall rate of unemployment = [Fill in the blank], percent Real GDP in this country equals [Fill in the blank], units. The pdf file "HW3 Graph and Explanation" in the folder Homework Graphs explains the shape of the supply function. Basically, the graph assumes that the maximum number of people who are willing and able to work does not exceed 100 million due to population constraint.
View Explanation
Verified Answer
Please login to view
Step-by-Step Analysis
We’ll examine each fill-in value in the order they appear and connect them to the underlying concepts.
Real wage = 100.00
- Real wages are computed by dividing the nominal wage by the price level: Real wage = W / P. With W = 12,000 and P = 120, we get 12,000 / 120 = 100. Therefore, 100.00 is the correct real wage.
Natural rate of unemployment = 6.00
- The pr......Login to view full explanationLog in for full answers
We've collected over 50,000 authentic exam questions and detailed explanations from around the globe. Log in now and get instant access to the answers!
Similar Questions
The natural rate of unemployment is zero because a healthy economy should have everyone employed.
A hotel manager in Montreux notices that during winter off-season, 15% of hospitality workers are temporarily laid off. This type of unemployment is called:
Switzerland's unemployment rate is approximately 2.3% (2024). An economist would describe this as:
The business cycle fluctuations cause frictional unemployment in the economy, and this unemployment can be eliminated by providing more job networks.
More Practical Tools for Students Powered by AI Study Helper
Making Your Study Simpler
Join us and instantly unlock extensive past papers & exclusive solutions to get a head start on your studies!