Questions
SP25-BL-BUS-P481-5624 02. Static Time Series
Single choice
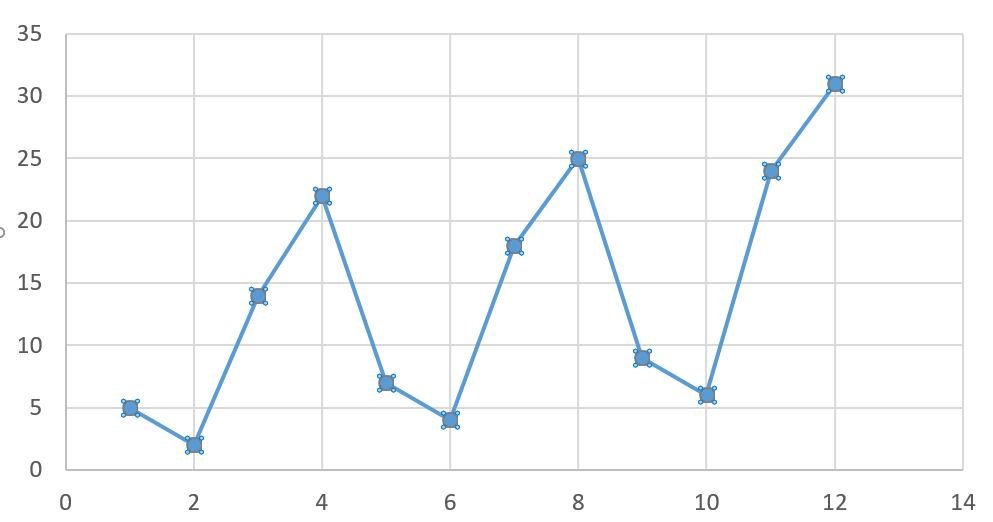
The above chart shows demand for leafblowers at a small hardware store. Which of the following describes the trend present in the graph?
View Explanation
Verified Answer
Please login to view
Step-by-Step Analysis
Take a look at the data points in the chart and trace how the quantities change over time. At first, values start around the mid-single digits, then dip to near zero, before rising more steeply in the middle period. As you move along the timeline, ......Login to view full explanationLog in for full answers
We've collected over 50,000 authentic exam questions and detailed explanations from around the globe. Log in now and get instant access to the answers!
Similar Questions
How many years of data are needed for trend analysis?
One way to think about the possibilities of the future based is to examine ________ based on historical and current data.
The percentage of people reporting that they are stressed has increased throughout the years.
Use the text and the graph about a government digital analytics program launched in 2013 to answer the question that follows. Source 1 Mobile traffic had a strong and steady growth from just 13% of all visitors on government websites in 2013 to nearly six out of ten (58%) visitors in 2023. The majority of mobile visitors (56%) used Apple iPhones when on government websites. In contrast, desktop visitors declined from 80% in 2013 to 40% in 2023. For desktop browsers, 43% of visitors used Chrome, 35% were on Safari, and 7% used Internet Explorer. Source 2 Which source of information above best answers the question “How did user behavior change from year to year between 2013 and 2023?”
More Practical Tools for Students Powered by AI Study Helper
Making Your Study Simpler
Join us and instantly unlock extensive past papers & exclusive solutions to get a head start on your studies!