Questions
APBIO142-030 with labs S25 - CollegeBoard* AP Exam Prep: Multiple Choice
Single choice
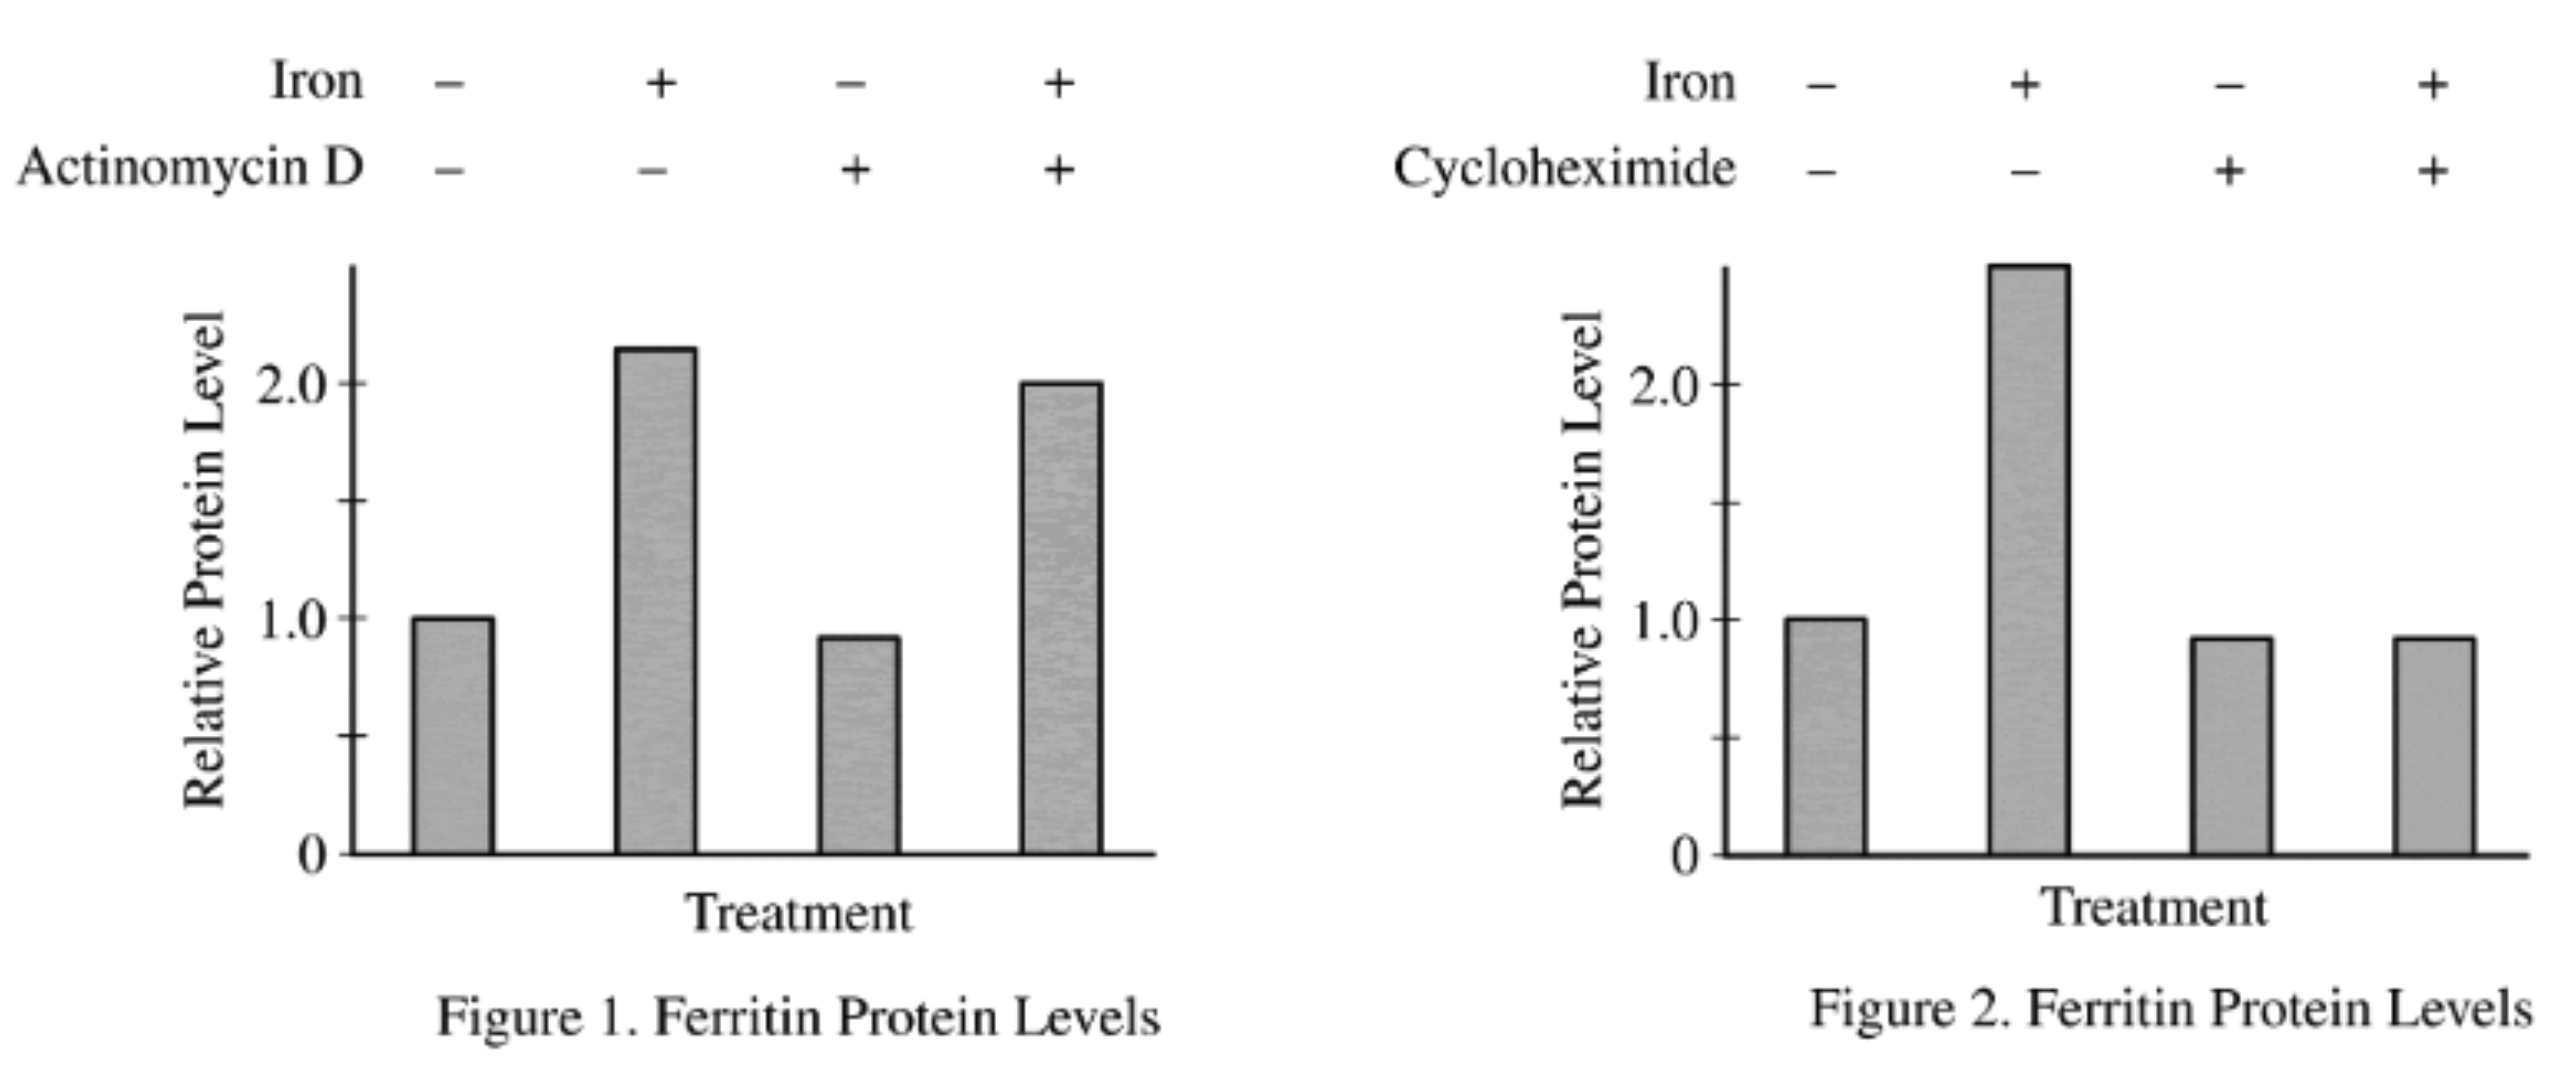
Iron is an essential nutrient that is acquired by organisms from the environment. When intracellular levels of iron are relatively high, living cells synthesize an iron-storage protein called ferritin. The induction of ferritin synthesis by iron was investigated in rats. Figure 1 shows the results of an experiment in which cellular levels of ferritin protein were measured in the presence or absence of iron and actinomycin D, a drug that inhibits transcription. Figure 2 shows the results of an experiment in which cellular levels of ferritin protein were measured in the presence or absence of iron and cycloheximide, a drug that inhibits translation. The horizontal axes are labeled Treatment, and the vertical axes are labeled Relative Protein Level. Five tick marks appear on the vertical axis, from bottom to top, the first tick mark is labeled zero, the third tick mark is labeled one point zero, and the fifth tick mark is labeled two point zero. The graph on the left is labeled Figure one. Ferritin Protein Levels. Four vertical bars appear along the horizontal axis, and the presence or absence of Iron and Actinomycin D is indicated above each bar. The data in the graph, from left to right, are as follows: Bar 1: Absence of Iron; Absence of Actinomycin D; Relative Protein Level one point zero. Bar 2: Presence of Iron; Absence of Actinomycin D; Relative Protein Level two point two. Bar 3: Absence of Iron; Presence of Actinomycin D; Relative Protein Level zero point nine. Bar 4: Presence of Iron; Presence of Actinomycin D; Relative Protein Level two point zero. The graph on the right is labeled Figure 2. Ferritin Protein Levels. Four vertical bars appear along the horizontal axis, and the presence or absence of Iron and Cycloheximide is indicated above each bar. The data in the graph, from left to right, are as follows: Bar 1: Absence of Iron; Absence of Cycloheximide; Relative Protein Level one point zero. Bar 2: Presence of Iron; Absence of Cycloheximide; Relative Protein Level two point five. Bar 3: Absence of Iron; Presence of Cycloheximide; Relative Protein Level zero point nine. Bar 4: Presence of Iron; Presence of Cycloheximide; Relative Protein Level zero point nine. The gene sequences responsible for the iron mediated changes in ferritin protein levels are highly conserved and are called iron response elements (IREs). IREs have been observed in a number of genes involved in iron transport and metabolism. The IRE sequences found in the ferritin gene are found in all multicellular organisms, whereas other non-ferritin IRE sequences are found only in certain vertebrate organisms. Which of the following is the best explanation for the observations?
Options
A.Ferritin IREs have evolved independently in different evolutionary lineages, whereas nonferritin IREs arose in the common ancestor of multicellular organisms.
B.Ferritin IREs arose in the common ancestor of multicellular organisms, whereas nonferritin IREs arose later in specific evolutionary lineages.
C.Ferritin IREs arose in diverse organisms by convergent evolution, while the nonferritin IREs arose by recombination events between closely related species.
D.Nonferritin IREs arose at different times in the common ancestor of multicellular organisms.
View Explanation
Verified Answer
Please login to view
Step-by-Step Analysis
We are given data about iron-responsive element (IRE) sequences and their distribution across ferritin and nonferritin genes, with ferritin IREs being widespread across multicellular organisms and nonferritin IREs present only in certain vertebrates. Now let's evaluate each statement.
Option A: Ferritin IREs have evolved independently in different evolutionary lineages, whereas nonferritin IREs arose in the common ancestor of multicellular organisms.
This claim suggests parallel, independent origins for ferritin IREs in multiple lineages and places nonferritin IREs at a much earlier, universal origin. The observed pattern — ferritin IREs are conserved across mu......Login to view full explanationLog in for full answers
We've collected over 50,000 authentic exam questions and detailed explanations from around the globe. Log in now and get instant access to the answers!
Similar Questions
The first diagram below shows the levels of mRNA from two different genes (bicoid and caudal) at different positions along the anterior-posterior axis of a Drosophila egg immediately before fertilization. The second diagram shows the levels of the two corresponding proteins along the anterior-posterior axis shortly after fertilization. Which of the following conclusions is best supported by the data?
Iron is an essential nutrient that is acquired by organisms from the environment. When intracellular levels of iron are relatively high, living cells synthesize an iron-storage protein called ferritin. The induction of ferritin synthesis by iron was investigated in rats. Figure 1 shows the results of an experiment in which cellular levels of ferritin protein were measured in the presence or absence of iron and actinomycin D, a drug that inhibits transcription. Figure 2 shows the results of an experiment in which cellular levels of ferritin protein were measured in the presence or absence of iron and cycloheximide, a drug that inhibits translation. The data can best be used to support which of the following claims about the mechanism for regulating ferritin gene expression?
Excess intracellular iron is toxic to cells (iron-induced toxicity). Ferritin is an intracellular iron storage protein that binds excess iron. The presence of ferritin can protect cells from iron-induced toxicity. In an experiment to investigate the effects of dietary iron intake on ferritin synthesis, rats were given food containing different amounts of iron. Subsequently, the levels of ferritin protein in the liver were measured. The results are shown in Figure 1. The figure presents the graph of a curve in the first quadrant of a coordinate plane. The horizontal axis is labeled “Dietary Iron, in milligrams per kilogram,” and the numbers 0 through 125, in increments of 25, are indicated. The vertical axis is labeled “Ferritin Abundance, relative to control,” and the numbers 0 through 2.0, in increments of 0.5, are indicated. A dashed horizontal line is drawn across the graph at a ferritin abundance of 1.0. The curve is composed of 6 points connected by line segments, with error bars given for each point. The points are given as follows. Note that all values are approximate. Point 1. 0, comma 0. No error bar is visible. Point 2. 11, comma 0. No error bar is visible. Point 3. 19, comma 0.1. The error bar spans plus or minus 0.05. Point 4. 38, comma 1.0. The error bar spans plus or minus 0.05. Point 5. 72, comma 1 point 6. The error bar spans plus or minus 0.1. Point 6. 110, comma 1 point 5. The error bar spans plus or minus 0.07. Figure 1. Effects of dietary iron on ferritin levels in rat liver Based on these and other data, researchers have developed the following model demonstrating how ferritin synthesis is regulated by iron. When iron levels are low, a repressor of translation, iron response protein (IRP), binds to an iron response element (IRE), which is a stem-loop structure near the 5' end of ferritin mRNA. When iron levels are high, intracellular iron binds to the IRP, and the iron-IRP complex dissociates from the IRE, permitting ribosomes to proceed with the translation of ferritin mRNA. Figure 2 represents the model of the regulation of ferritin mRNA translation by iron. The figure is a model of the regulation of ferritin synthesis by iron and shows the m R N A for ferritin in two situations: when the intracellular concentration of iron is low and when the intracellular concentration of iron is high. When the intracellular concentration of iron is low, a stem loop structure forms in the ferritin m R N A, 5 prime to the coding region of the m R N A. This stem loop structure includes a sequence called an iron response element (I R E) that is recognized and bound by the iron response protein (I R P). The binding of the I R P to the I R E blocks translation of the ferritin m R N A. When the intracellular concentration of iron is high, iron binds to the iron response protein and causes the protein to dissociate from the I R E containing stem loop structure. This allows translation of the ferritin m R N A to proceed, and ferritin is produced. Figure 2. Model of regulation of ferritin synthesis by iron Based on the model of ferritin synthesis presented in Figure 2, which of the following describes the role of feedback on the control of intracellular iron levels?
Excess intracellular iron is toxic to cells (iron-induced toxicity). Ferritin is an intracellular iron storage protein that binds excess iron. The presence of ferritin can protect cells from iron-induced toxicity. In an experiment to investigate the effects of dietary iron intake on ferritin synthesis, rats were given food containing different amounts of iron. Subsequently, the levels of ferritin protein in the liver were measured. The results are shown in Figure 1. The figure presents the graph of a curve in the first quadrant of a coordinate plane. The horizontal axis is labeled “Dietary Iron, in milligrams per kilogram,” and the numbers 0 through 125, in increments of 25, are indicated. The vertical axis is labeled “Ferritin Abundance, relative to control,” and the numbers 0 through 2.0, in increments of 0.5, are indicated. A dashed horizontal line is drawn across the graph at a ferritin abundance of 1.0. The curve is composed of 6 points connected by line segments, with error bars given for each point. The points are given as follows. Note that all values are approximate. Point 1. 0, comma 0. No error bar is visible. Point 2. 11, comma 0. No error bar is visible. Point 3. 19, comma 0.1. The error bar spans plus or minus 0.05. Point 4. 38, comma 1.0. The error bar spans plus or minus 0.05. Point 5. 72, comma 1 point 6. The error bar spans plus or minus 0.1. Point 6. 110, comma 1 point 5. The error bar spans plus or minus 0.07. Figure 1. Effects of dietary iron on ferritin levels in rat liver. Based on these and other data, researchers have developed the following model demonstrating how ferritin synthesis is regulated by iron. When iron levels are low, a repressor of translation, iron response protein (IRP), binds to an iron response element (IRE), which is a stem-loop structure near the 5¢ end of ferritin mRNA. When iron levels are high, intracellular iron binds to the IRP, and the iron-IRP complex dissociates from the IRE, permitting ribosomes to proceed with the translation of ferritin mRNA. Figure 2 represents the model of the regulation of ferritin mRNA translation by iron. The figure is a model of the regulation of ferritin synthesis by iron and shows the m R N A for ferritin in two situations: when the intracellular concentration of iron is low and when the intracellular concentration of iron is high. When the intracellular concentration of iron is low, a stem loop structure forms in the ferritin m R N A, 5 prime to the coding region of the m R N A. This stem loop structure includes a sequence called an iron response element (I R E) that is recognized and bound by the iron response protein (I R P). The binding of the I R P to the I R E blocks translation of the ferritin m R N A. When the intracellular concentration of iron is high, iron binds to the iron response protein and causes the protein to dissociate from the I R E containing stem loop structure. This allows translation of the ferritin m R N A to proceed, and ferritin is produced. Figure 2. Model of regulation of ferritin synthesis by iron Based on the model of ferritin synthesis presented in Figure 2, which of the following best describes the mechanism whereby iron most likely regulates ferritin production?
More Practical Tools for Students Powered by AI Study Helper
Making Your Study Simpler
Join us and instantly unlock extensive past papers & exclusive solutions to get a head start on your studies!