Questions
Single choice
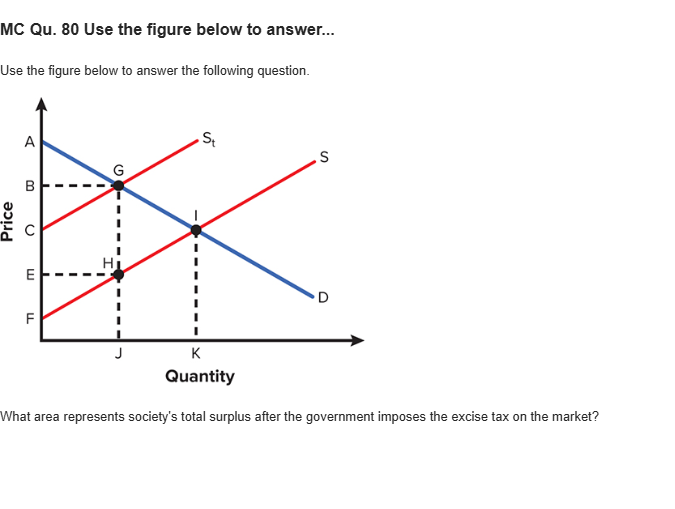
MC Qu. 80 Use the figure below to answer... Use the figure below to answer the following question. The horizontal axis is labeled quantity and the vertical axis is labeled price. The two supply curves, S sub t and S starts from different points on the vertical axis and rises parallel to each other. Curve S starts from point F on the lower section of the vertical axis. It then rises through point H (J, E). Curve S sub t starts from point C on the middle section of the vertical axis. It then rises through point G (J, B). The demand curve D falls from point A on the top section of the vertical axis. It intersects s sub t at point G (J, B) and S at point I (K, C). What area represents society's total surplus after the government imposes the excise tax on the market?
Options
A.triangle FHE plus triangle BGA
B.triangle GHI
C.rectangle EHBG plus triangle BGA
D.triangle FHE plus triangle BGA plus rectangle EHGB
View Explanation
Verified Answer
Please login to view
Step-by-Step Analysis
To analyze the total surplus after the excise tax, we must identify which geometric areas on the labeled supply and demand diagram represent the sum of consumer and producer surplus that remains for society.
Option 1: triangle FHE plus triangle BGA. This pairing corresponds to the portions of the welfare diagram that remain as the post-tax equilibrium areas for consumer and producer surplus, capturing the retained gains from trade after the tax we......Login to view full explanationLog in for full answers
We've collected over 50,000 authentic exam questions and detailed explanations from around the globe. Log in now and get instant access to the answers!
Similar Questions
Question at position 6 What are the values of total surplus before and after tax imposition?(TS0=10.5,TS1=6)\left(TS^0=10.5,TS^1=6\right)(TS0=12.5,TS1=10)\left(TS^0=12.5,TS^1=10\right)(TS0=13.5,TS1=12)\left(TS^0=13.5,TS^1=12\right)(TS0=15,TS1=10.5)\left(TS^0=15,TS^1=10.5\right)
Table 7-11[table] Price(Dollars per unit) | Quantity Demanded(Units) | Quantity Supplied(Units) 12.00 | 0 | 36 10.00 | 3 | 30 8.00 | 6 | 24 6.00 | 9 | 18 4.00 | 12 | 12 2.00 | 15 | 6 0.00 | 18 | 0 [/table]Refer to Table 7-11. Both the demand curve and the supply curve are straight lines. At equilibrium, total surplus is
Table 7-11[table] Price(Dollars per unit) | Quantity Demanded(Units) | Quantity Supplied(Units) 12.00 | 0 | 36 10.00 | 3 | 30 8.00 | 6 | 24 6.00 | 9 | 18 4.00 | 12 | 12 2.00 | 15 | 6 0.00 | 18 | 0 [/table]Refer to Table 7-11. At a price of $2.00, total surplus is
Moving production from a high-cost producer to a low-cost producer will
More Practical Tools for Students Powered by AI Study Helper
Making Your Study Simpler
Join us and instantly unlock extensive past papers & exclusive solutions to get a head start on your studies!