Questions
Multiple choice
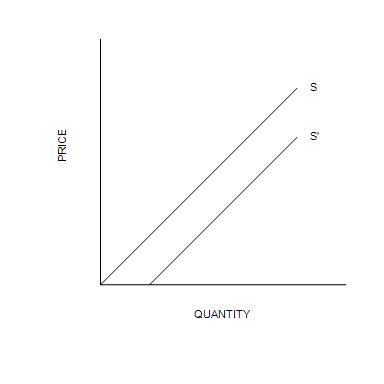
Figure 4-6Refer to Figure 4-6. The shift from S' to S could be caused by
Options
A.an increase in the number of sellers.
B.an increase in input prices.
C.a decrease in the number of buyers.
D.an increase in the price of the good.
View Explanation
Verified Answer
Please login to view
Step-by-Step Analysis
To start, let's identify what the graph is showing: S and S' are both upward-sloping supply curves plotted with price on the vertical axis and quantity on the horizontal axis. A shift from S' to S represents a rightward shift in supply, meaning at every price level, a larger quantity is supplied.
Option 1: an increase in the num......Login to view full explanationLog in for full answers
We've collected over 50,000 authentic exam questions and detailed explanations from around the globe. Log in now and get instant access to the answers!
Similar Questions
An improvement in production technology will shift the
Part D: An increase in the price of pizza sauce will cause a movement from point B on supply curve S2 to
Part B: An increase in supply is represented by the movement from S2 to
What effect would a new tax on producers likely have on the supply curve?
More Practical Tools for Students Powered by AI Study Helper
Making Your Study Simpler
Join us and instantly unlock extensive past papers & exclusive solutions to get a head start on your studies!