Questions
Single choice
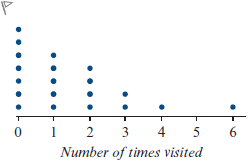
The shape of the data distribution displayed by this dot plot is best described as:
Options
A.a. symmetric
B.b. negatively skewed
C.c. positively skewed
D.d. none of the above
View Explanation
Verified Answer
Please login to view
Step-by-Step Analysis
To begin, let’s interpret the dot plot: most data points are clustered toward the lower end (near 0, 1, 2), with fewer observations as the values increase toward higher numbers, creating a stretch of data that trails off to the right.
Option a (symmetric): A symmetric distribution would have r......Login to view full explanationLog in for full answers
We've collected over 50,000 authentic exam questions and detailed explanations from around the globe. Log in now and get instant access to the answers!
Similar Questions
偏度衡量数值分布的对称性,不对称的分布称为偏斜分布。给定一个变量的直方图,下列哪种偏度类型最能描述该分布?
In a right-skewed distribution
Histograms (1 mark)Which of the following statements about the following histogram of data points in 'y' is true:[Fill in the blank]
If the shape of a distribution is skewed, with a long tail projecting longer to the left than to the right, how would the distribution be skewed?
More Practical Tools for International Students
Making Your Study Simpler
Join us and instantly unlock extensive past papers & exclusive solutions to get a head start on your studies!