Questions
Single choice
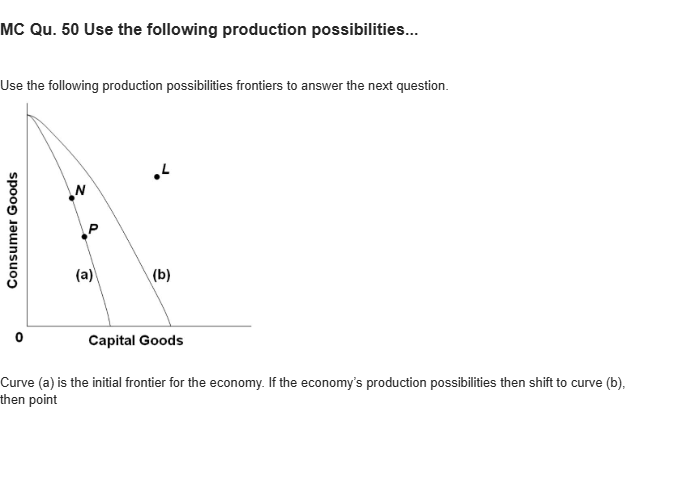
MC Qu. 50 Use the following production possibilities... Use the following production possibilities frontiers to answer the next question. The horizontal axis is labeled capital goods and the vertical axis is labeled consumer goods. Two decreasing curves are drawn from the same point at the vertical axis. First curve closer to the origin has to points marked as N and P. The region between the origin and the first curve is labeled a and the region beyond the second curve is labeled b. A point marked as L is plotted in the region b. Curve (a) is the initial frontier for the economy. If the economy’s production possibilities then shift to curve (b), then point
Options
A.N would indicate some unemployment or underemployment of resources.
B.L would indicate some unemployment or underemployment of resources.
C.N would still indicate a case of full production and full employment of resources.
D.L would still indicate a case of full production and full employment of resources.
View Explanation
Verified Answer
Please login to view
Step-by-Step Analysis
The question provides two production possibility frontiers (a and b) with capital goods on the horizontal axis and consumer goods on the vertical axis. Region a lies between the origin and frontier (a), while region b lies beyond frontier (b). A point L is plotted in region b, and a point N or P is plotted somewhere inside frontier (a). The scenario states that the economy’s production possibilities shift from frontier (a) to frontier (b).
Option 1: N would indicate some unemployment or underemployment of resources. Since N is located inside the initial frontier (a), it represents a point where not all resources are fully utilized given fronti......Login to view full explanationLog in for full answers
We've collected over 50,000 authentic exam questions and detailed explanations from around the globe. Log in now and get instant access to the answers!
Similar Questions
Given the production possibilities curve above, which of the following represents a movement from efficiency to inefficiency?
Refer to the production possibility curve for Marketopia below. The graph indicates that with the resources and technology it has available, Marketopia
Using the PPF graph below identify the points that are attainable with current resources.
Refer to the following graph to answer the next question. In the graph, Point C is a(n) _________ point.
More Practical Tools for Students Powered by AI Study Helper
Making Your Study Simpler
Join us and instantly unlock extensive past papers & exclusive solutions to get a head start on your studies!