Questions
Single choice
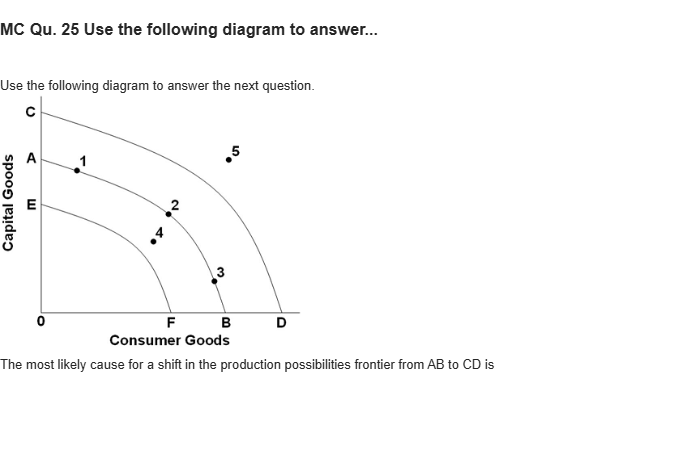
MC Qu. 25 Use the following diagram to answer... Use the following diagram to answer the next question. The horizontal axis is labeled consumer goods and lists markings from left to right as F, B, and D. The vertical axis is labeled capital goods and lists markings from bottom to top as E, A, and C. Three concentric curves are drawn from the vertical axis to the horizontal axis and the curves' overall shape is a quarter circle, approximately. First curve initiates from E and ends at F, second curve initiates from A and ends at B, and the third curve initiates from C and ends at D at the horizontal axis. Second curve has three points labeled as 1, 2, and 3. A point labeled 4 is plotted to the left of point 2 (between first and second curve). A point labeled 5 is plotted to the right of point 2 (after the third curve). The most likely cause for a shift in the production possibilities frontier from AB to CD is
Options
A.an increase in government purchase of the economy's output.
B.an increase in the spending of business and consumers.
C.the use of the economy's resources in a less efficient way.
D.an increase in the quantity and quality of labor resources.
View Explanation
Verified Answer
Please login to view
Step-by-Step Analysis
Question restatement: The diagram shows three curved PPF lines with points labeled along them, and the prompt asks for the most likely cause for a shift in the production possibilities frontier from AB to CD. Answer options:
1) an increase in the government purchase of the economy's output.
2) an increase in the spending of business and consumers.
3) the use of the economy's resources in a less efficient way.
4) an increase in the quantity and quality of labor resources.
Option 1: An in......Login to view full explanationLog in for full answers
We've collected over 50,000 authentic exam questions and detailed explanations from around the globe. Log in now and get instant access to the answers!
Similar Questions
Given the production possibilities curve above, which of the following represents a movement from efficiency to inefficiency?
Refer to the production possibility curve for Marketopia below. The graph indicates that with the resources and technology it has available, Marketopia
Using the PPF graph below identify the points that are attainable with current resources.
Refer to the following graph to answer the next question. In the graph, Point C is a(n) _________ point.
More Practical Tools for Students Powered by AI Study Helper
Making Your Study Simpler
Join us and instantly unlock extensive past papers & exclusive solutions to get a head start on your studies!