Questions
Single choice
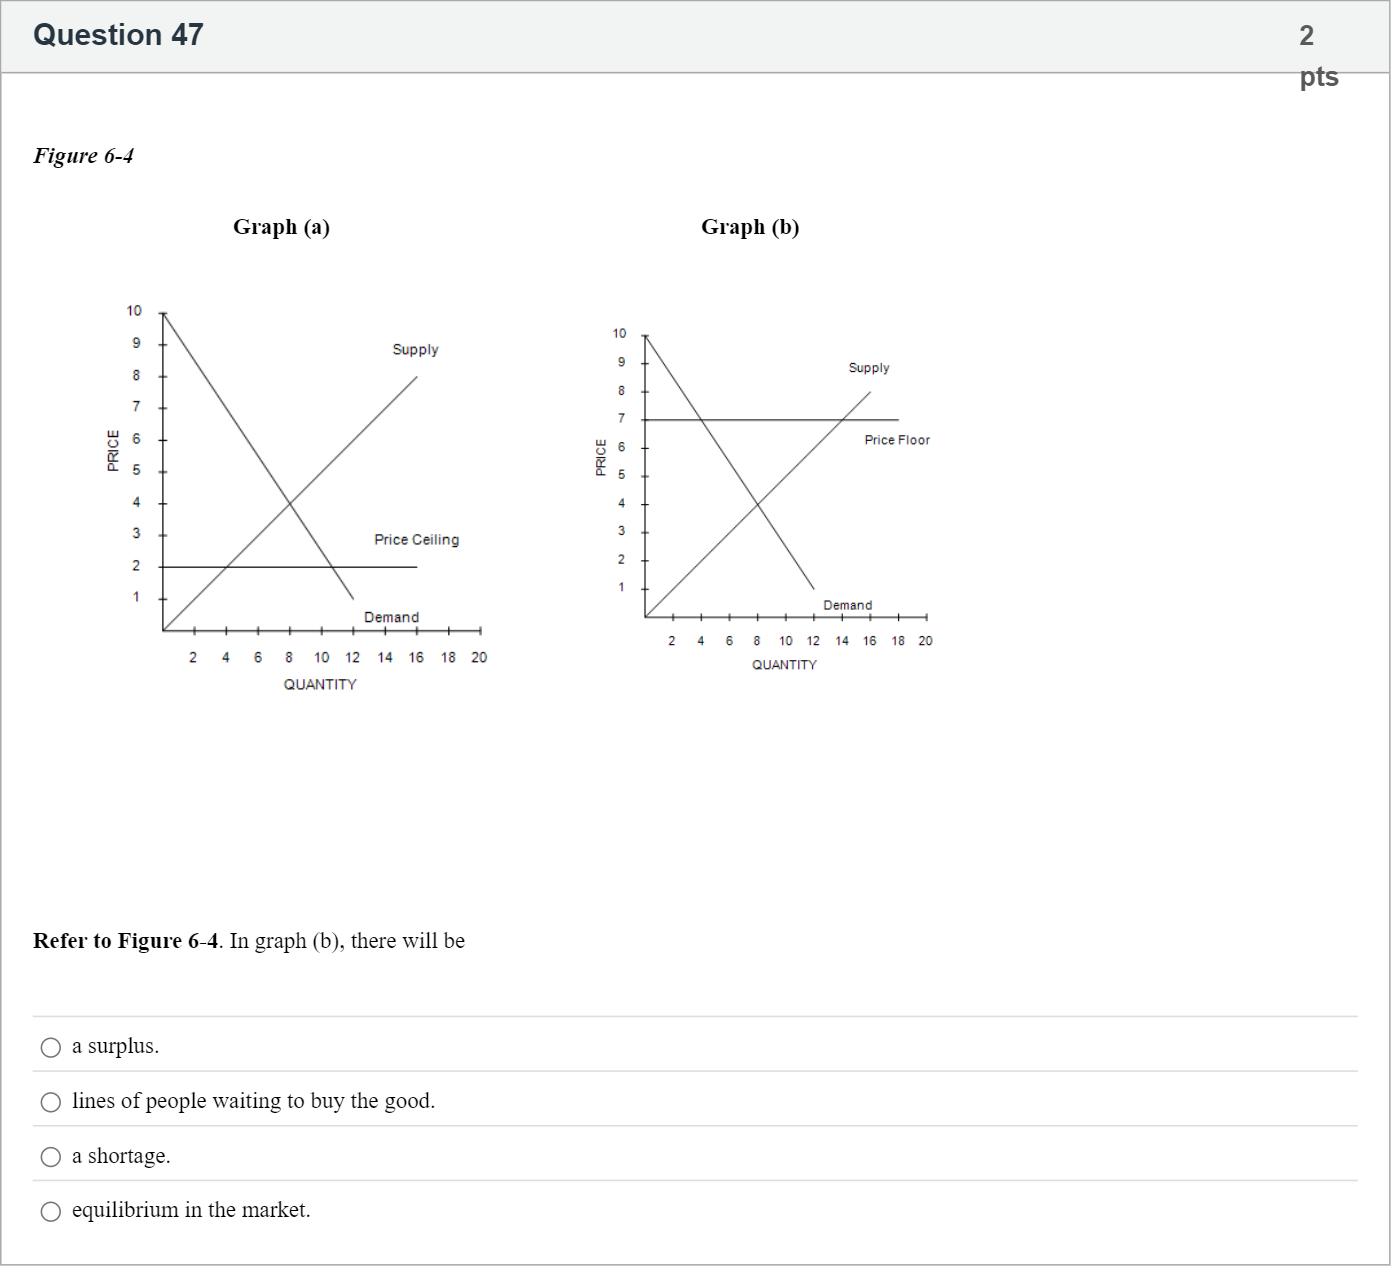
Figure 6-4 Graph (a) Graph (b) Refer to Figure 6-4. In graph (b), there will be
Options
A.a surplus.
B.lines of people waiting to buy the good.
C.a shortage.
D.equilibrium in the market.
View Explanation
Verified Answer
Please login to view
Step-by-Step Analysis
To approach this question, I will evaluate each option in the context of Graph (b) in Figure 6-4.
Option 1: a surplus. In Graph (b), the price floor is set above the market-clearing price, which creates a situation where the quantity supplied exceeds the quantity demanded. This mismatch results i......Login to view full explanationLog in for full answers
We've collected over 50,000 authentic exam questions and detailed explanations from around the globe. Log in now and get instant access to the answers!
Similar Questions
A price floor is
22. The price floor ( min price) creates excess supply (surplus)
If a price floor at P4 is set to help farmers in terms of income and government wants to assure farmers that their output will be purchased, the government would have to purchase an amount of output equal to:
Which of the following would increase quantity supplied, decrease quantity demanded, and increase the price that consumers pay?
More Practical Tools for Students Powered by AI Study Helper
Making Your Study Simpler
Join us and instantly unlock extensive past papers & exclusive solutions to get a head start on your studies!