Questions
PSYC20009_2025_SM2 Lecture 3 Quiz
Single choice
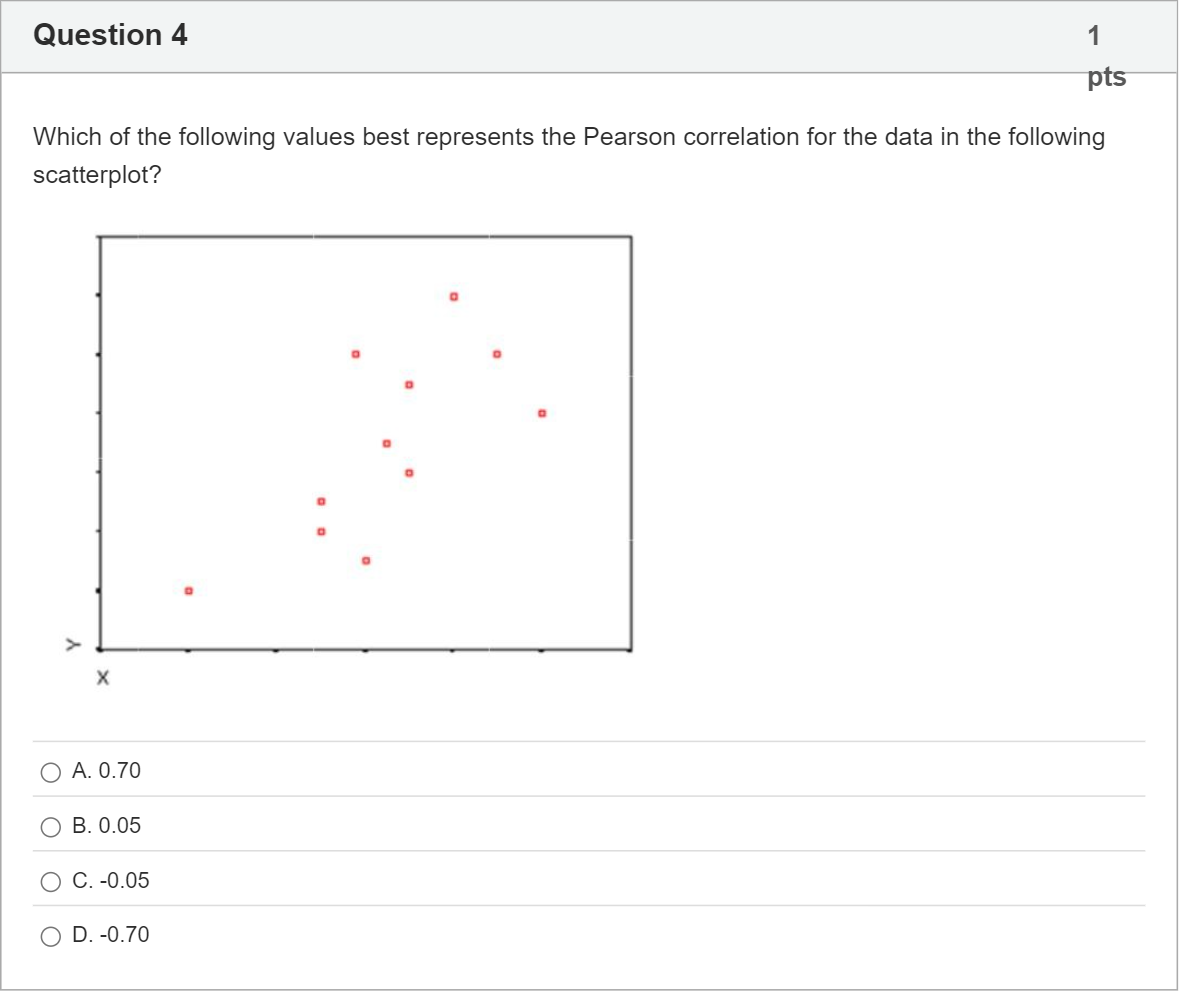
Which of the following values best represents the Pearson correlation for the data in the following scatterplot?
Options
A.A. 0.70
B.B. 0.05
C.C. -0.05
D.D. -0.70
View Explanation
Verified Answer
Please login to view
Step-by-Step Analysis
Interpreting the scatterplot, the data show a clear upward (positive) trend: as X increases, Y tends to increase as well. The points are fairly closely clustered around an ascending line, indic......Login to view full explanationLog in for full answers
We've collected over 50,000 authentic exam questions and detailed explanations from around the globe. Log in now and get instant access to the answers!
Similar Questions
Which of the following values best represents the Pearson correlation for the data in the following scatterplot?
A researcher is interested in examining the relationship between the number of bears in an area (Y) and its human population (X). The scatterplot of the data is reproduced below. This scatterplot would suggest that the correlation (Pearson’s r) for this distribution would be:
You take a sample of n = 70 from a population of adolescents, and conduct a correlation analysis to investigate the relationship between level of anxiety and time spent exercising. Both variables are measured continuously via self-report questionnaires. You find that r = -.45 and p < .05. What can you conclude on the basis of your sample?
You are given the following scatterplot, with Variable A on the Y-Axis and Variable B on the X-Axis: If the axes are then swapped, such that Variable B is now on the Y-Axis, and Variable A is now on the X-Axis, what could you say about the change in the value of Pearson’s correlation coefficient (r)?
More Practical Tools for Students Powered by AI Study Helper
Making Your Study Simpler
Join us and instantly unlock extensive past papers & exclusive solutions to get a head start on your studies!