Questions
2025.1 CH BBA4073 Quiz 6.2 - Correlation and Regression Analysis
Multiple fill-in-the-blank
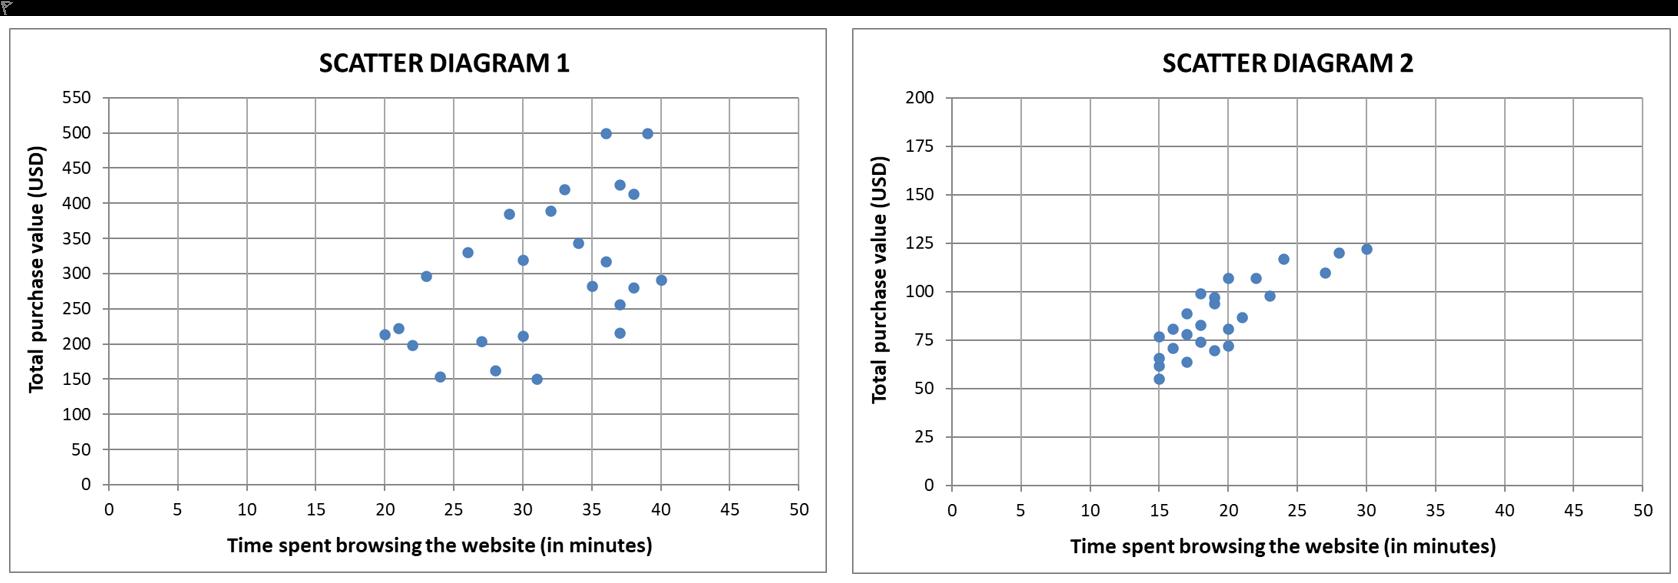
Question text An online retail company conducted a study to understand the relationship between customers’ time spent browsing the website (measured in minutes) and their total purchase value (in USD) during a single shopping session. The company is particularly interested in comparing this relationship between male and female customers to tailor marketing strategies effectively.Data was collected from a sample of 25 male customers and 25 female customers. For each customer, the total browsing time and the total amount spent were recorded.Scatter diagrams illustrating the data for male and female customers are provided below. The accompanying Excel file contains the full dataset.Apply correlation and regression methods to both groups and answer the following questions. Link to Excel spreadsheet with the data collected for this studyIf needed, please round your answers to two decimal places.Use a dot (".") as the decimal separator. QUESTIONS 1. Which scatter diagram presents data collected about female customers?Answer: Answer 1 Question 1[select: , scatter diagram 1, scatter diagram 2] 2. Which scatter diagram presents data collected about male customers?Answer: Answer 2 Question 1[select: , scatter diagram 1, scatter diagram 2] 3. What is the relationship between time spent browsing and total purchase value for female customers?Correlation coefficient r =Answer 3 Question 1[input], which indicates Answer 4 Question 1[select: , perfect, strong, moderate, weak] and Answer 5 Question 1[select: , positive, negative] correlation. 4. What is the relationship between time spent browsing and total purchase value for male customers?Correlation coefficient r =Answer 6 Question 1[input], which indicates Answer 7 Question 1[select: , perfect, strong, moderate, weak] and Answer 8 Question 1[select: , positive, negative] correlation.4. What is the unit of measurement for the correlation coefficient r between browsing time and purchase value?Answer: Answer 9 Question 1[select: , Minutes, Dollars, Minutes per Dollar, None; the correlation coefficient is unitless., Dollars per Minute, %] 5. What would happen to the correlation coefficient r for male customers if the purchase values were converted to Swiss Francs (CHF)?Answer: Multiple choice 1 Question 1The correlation coefficient would remain the same because it is unaffected by changes in units of measurement.Without calculations, we cannot predict what would happen to the correlation coefficient.The correlation coefficient would increase because CHF values are higher.The correlation coefficient would decrease because currency conversion changes scale.6. According to the regression model found for female customers, what would be the predicted total purchase value for a customer who spends 0 minutes browsing?Answer: Answer 10 Question 1[input] USD. 7. According to the regression model found for male customers, what would be the predicted total purchase value for a customer who spends 0 minutes browsing?Answer: Answer 11 Question 1[input] USD. 8. According to the regression model found for female customers, by how much does the total purchase value increase for each additional minute spent browsing?Answer: Answer 12 Question 1[input] USD. 9. According to the regression model found for male customers, by how much does the total purchase value increase for each additional minute spent browsing?Answer: Answer 13 Question 1[input] USD. 10. Calculate the coefficient of determination for the sample of female customers:Answer: R² =Answer 14 Question 1[input] %. 11. Calculate the coefficient of determination for the sample of male customers:Answer: R² =Answer 15 Question 1[input] %.12. Calculate 100% - R² = for the sample of male customers and select the correct interpretation:Answer: 100% - R² =Answer 16 Question 1[input] % and it represents Multiple choice 2 Question 1the proportion of variability in purchase value explained by factors other than browsing time, e.g., discount sensitivity or customer income.the percentage of customers who spent less than the average purchase value.an error in measuring browsing time.the portion of customers who did not make a purchase despite browsing.13. Which measure provides information about how well the regression model explains the variability in purchase values?Answer: Answer 17 Question 1[select: , intercept, coefficient of variation, coefficient of determination, correlation coefficient, slope]14. Which of the following statements about R² is the only correct one?Answer: Multiple choice 3 Question 1A positive R² always indicates a positive relationship between the variables.A lower R² for female customers indicates that a smaller proportion of the variation in purchase value is explained by variation in browsing time.A lower R² for female customers means that the model fits the female data better than the male data.R² measures the steepness of the regression line, so a lower R² for female customers means a flatter slope.15. Why is R² for the sample of female customers not equal to 100%?Answer: Multiple choice 4 Question 1Because other factors besides browsing time influence purchase value, and the model includes only one predictor: browsing time.Because the sample size is too small.Because female purchase behavior is unpredictable.Because the browsing time includes measurement errors.16. Which of the following statements is the only correct one? Answer: Multiple choice 5 Question 1Female customers spend less USD per minute browsing than male customers.The intercept of the regression model represents the purchase value for customers who browse for 1 hour.Forecasting the purchase value for a customer with a browsing time of 35 minutes represents extrapolation for male customers and interpolation for female customers.The regression model shows that a male customer who browses for 25 minutes will spend more than a female customer who browses for 20 minutes.17. If a female customer browsed for 22 minutes, what would the regression model predict for her total purchase value?Answer: Answer 18 Question 1[input] USD.18. If a male customer browsed for 22 minutes, what would the regression model predict for his total purchase value?Answer: Answer 19 Question 1[input] USD.19. According to the regression model for female customers, estimating the purchase value for someone who browses for 32 minutes would be an example of:Answer: Answer 20 Question 1[select: , correlation analysis., interpolation., outlier detection., extrapolation.]20. According to the regression model for male customers, estimating the purchase value for someone who browses for 32 minutes would be an example of:Answer: Answer 21 Question 1[select: , correlation analysis., extrapolation., interpolation., outlier detection.] 21. Which of the following predictions would be considered interpolation for female customers? Answer:Answer 22 Question 1[select: , Predicting browsing time for a customer who spent 100 USD., Predicting browsing time for a customer who spent 250 USD., Predicting purchase value for a customer who browses for 45 minutes., Predicting purchase value for a customer who browses for 28 minutes.]22. Which of the following predictions would be considered extrapolation for male customers?Answer:Answer 23 Question 1[select: , Predicting browsing time for a customer who spent 75 USD., Predicting browsing time for a customer who spent 150 USD., Predicting purchase value for a customer who browses for 17 minutes., Predicting purchase value for a customer who browses for 37 minutes.] 23. Estimating the purchase value for a male customer who browses for 10 minutes using a regression model is: Answer:Answer 24 Question 1[select: , potentially unreliable., clearly correct., definitely precise., certainly accurate.]
View Explanation
Verified Answer
Please login to view
Step-by-Step Analysis
To approach these questions, I will first compare the two scatter diagrams conceptually and then address each option in turn, noting how the visuals align with the stated questions.
Option 1 and Option 2 correspond to which scatter diagram shows data for female and male customers, respectively.
- Diagram 1 shows a wider range of total purchase values, reaching up to around 500 USD, with data points spread over a broader time-on-site range. This suggests more variability in purchasing behavior.
- Diagram 2 shows data clustered in a narrower band, with total purchase values generally below ~120 USD and a tighter, more linear pattern.
- Given these visual cues, Diagram 1 is the more likely representation for female customers (larger, more variable purchases), while Diagram 2 corresponds to male customers (smaller, more consistent purchasing patterns).
Option 1: Which scatter diagram presents data collected about female customers?
- The plausible choice is Diagram 1, because it displays higher purchase values and wider dispersion that align with a more variable purchasing pattern often observed in the female group in this dataset.
- The alternative (Diagram 2) would misalign with the observed spread and magnitude, making it a less suitable match for female data.
Option 2: Which scatter diagram presents data collected about male customers?
- The plausible choice is Diagram 2, as it shows a tighter clustering of points at lower purchase values, indicative of a more compact relationship between browsing time and spend for males in this sample.
- Diagram 1, by contrast, would imply a more dispersed and higher-magnitude pattern, which is less consistent with the male data in this visualization.
Option 3: What is the relationship between time spent browsing and total purchase value for female customers? Correlation coefficient r = ___, which indicates ___ and ___ correlation.
- The female diagram (Diagram 1) shows an upward trend with considerable scatter. This suggests a positive relationship (as time on site increases, purch......Login to view full explanationLog in for full answers
We've collected over 50,000 authentic exam questions and detailed explanations from around the globe. Log in now and get instant access to the answers!
Similar Questions
In a consumer society, many adults channel creativity into buying things
Economic stress and unpredictable times have resulted in a booming industry for self-help products
People born without creativity never can develop it
A product has a selling price of $20, a contribution margin ratio of 40% and fixed cost of $120,000. To make a profit of $30,000. The number of units that must be sold is: Type the number without $ and a comma. Eg: 20000
More Practical Tools for Students Powered by AI Study Helper
Making Your Study Simpler
Join us and instantly unlock extensive past papers & exclusive solutions to get a head start on your studies!