Questions
Single choice
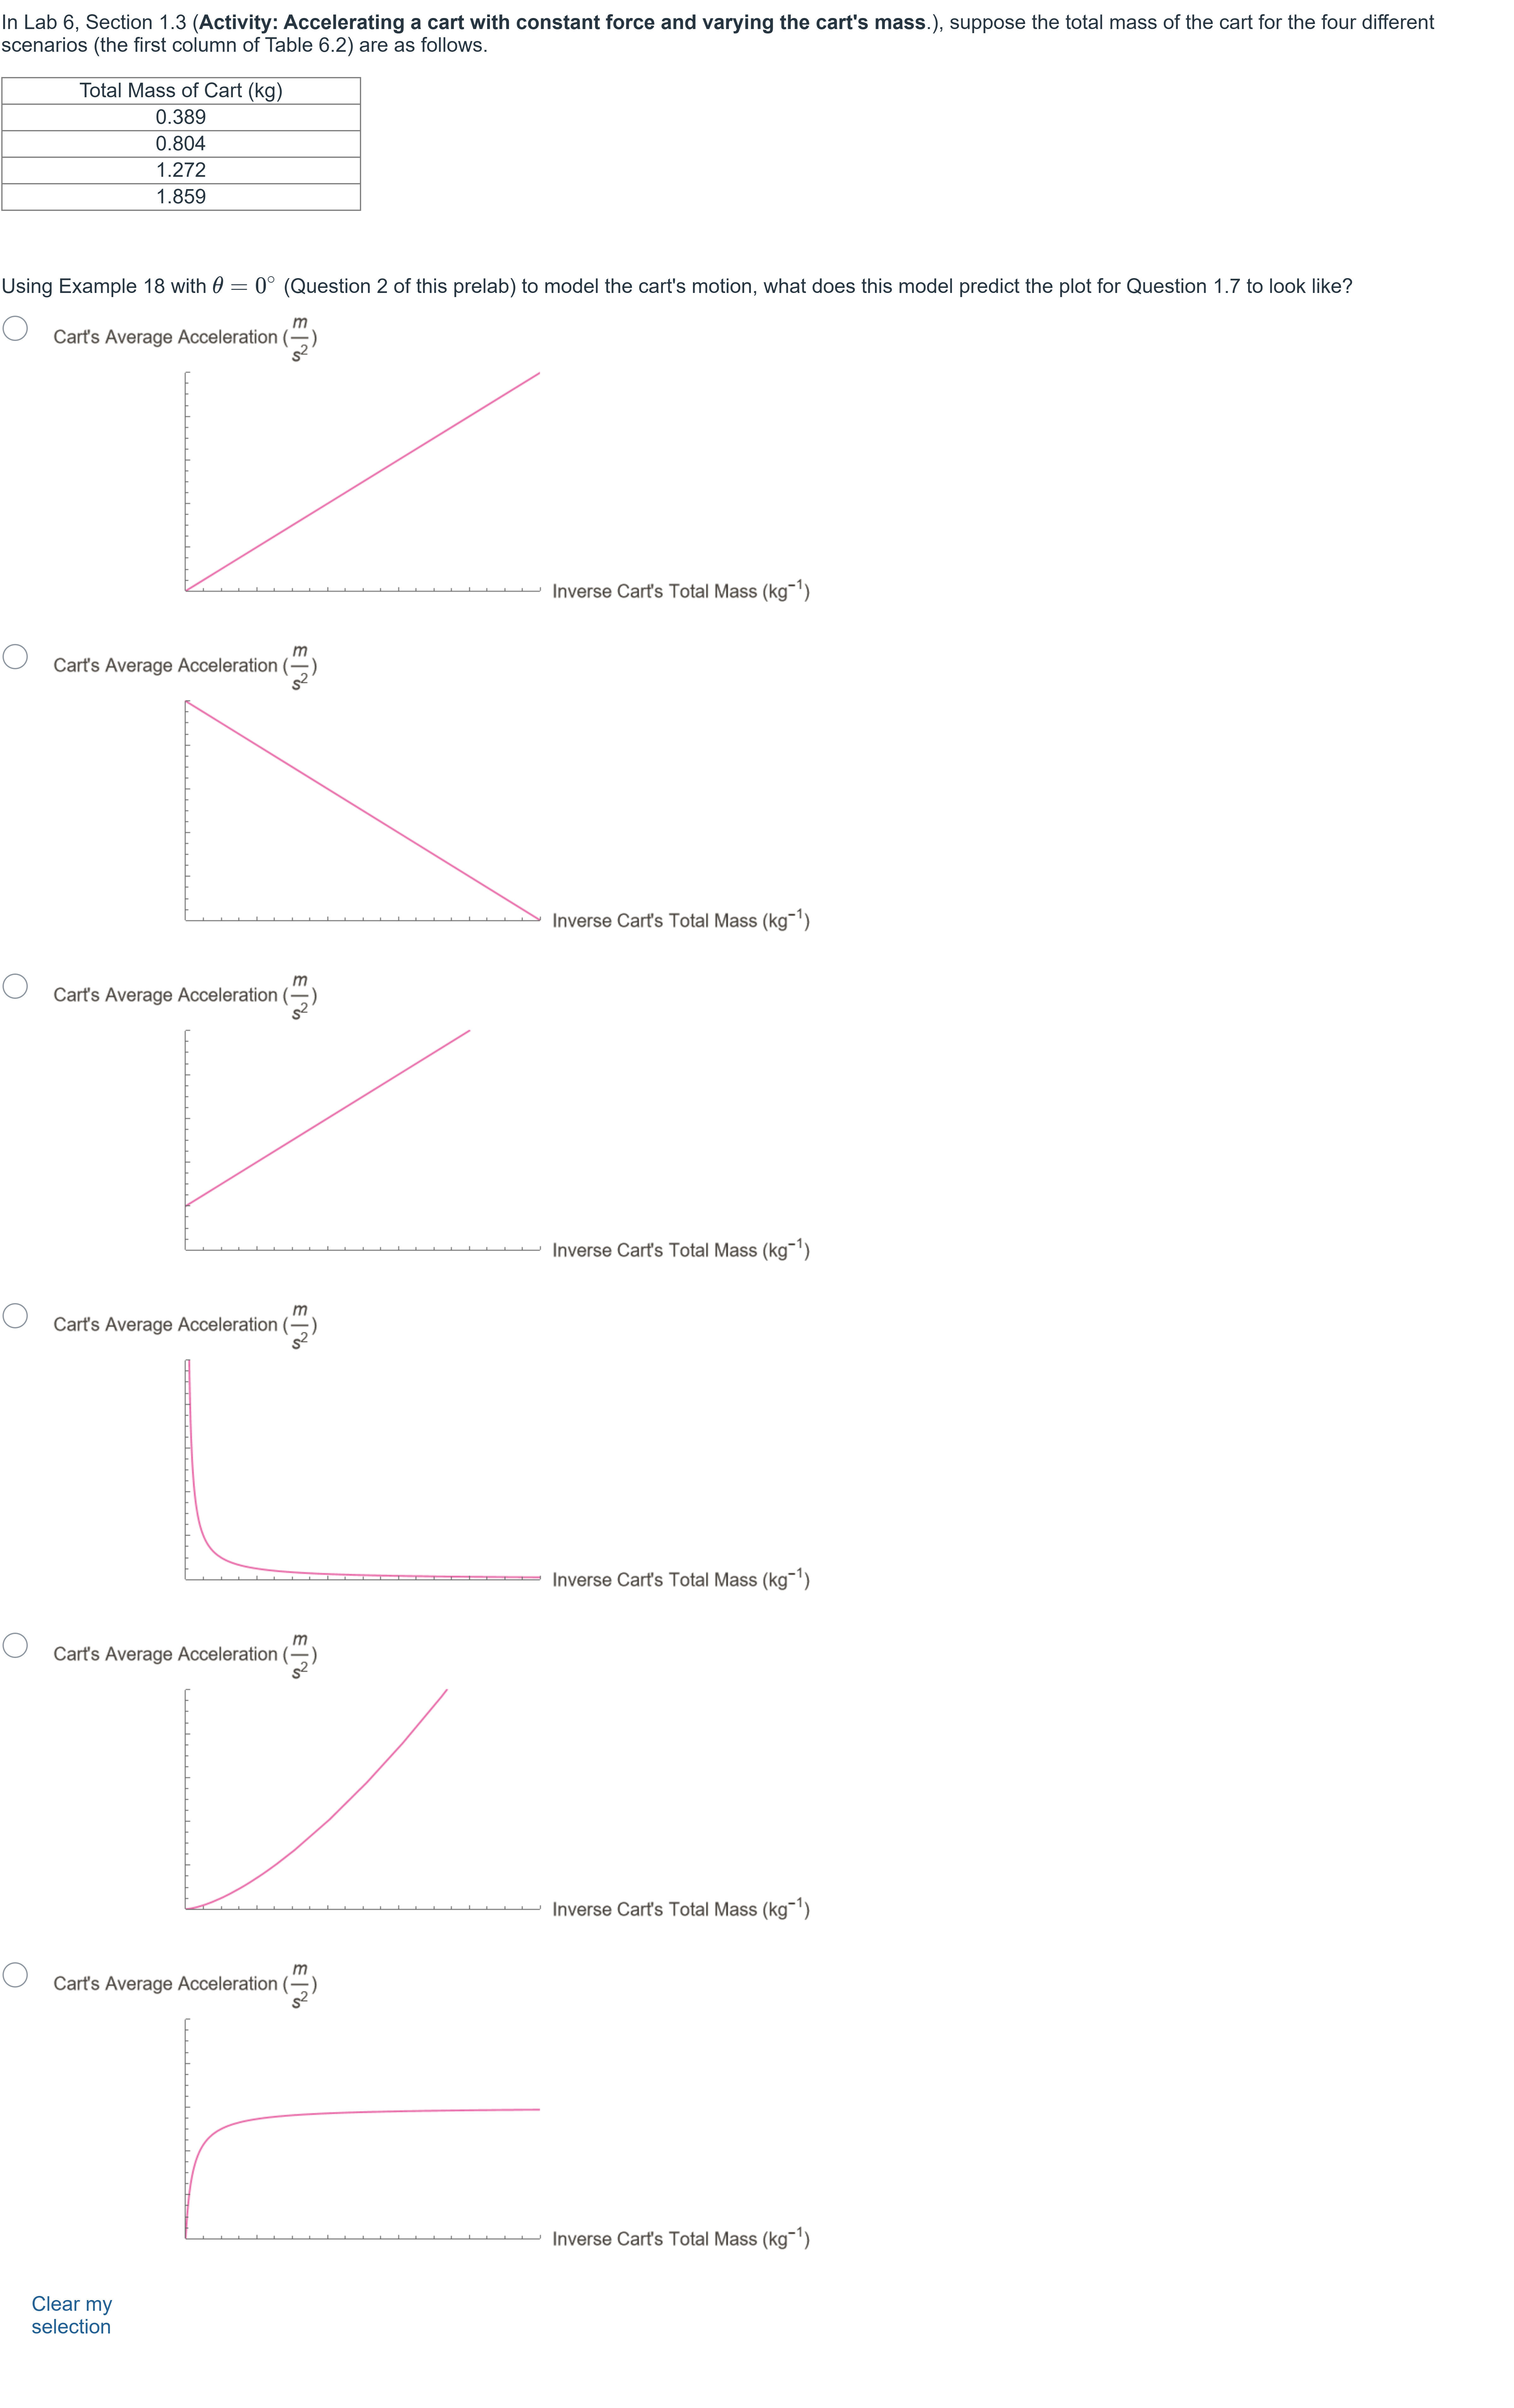
Question at position 3 In Lab 6, Section 1.3 (Activity: Accelerating a cart with constant force and varying the cart's mass.), suppose the total mass of the cart for the four different scenarios (the first column of Table 6.2) are as follows. [table] Total Mass of Cart (kg) 0.389 0.804 1.272 1.859 [/table] Using Example 18 with θ=0∘\theta=0^\circ (Question 2 of this prelab) to model the cart's motion, what does this model predict the plot for Question 1.7 to look like? Clear my selection
Options
A.
B.
C.
D.
E.
F.
View Explanation
Verified Answer
Please login to view
Step-by-Step Analysis
Let's carefully examine what the question is asking and what the underlying model predicts.
Option 1: The first plot shows a positive linear relationship between acceleration (a) and inverse mass (1/m).
This matches the basic physics relation F = m a. If a constant force F is applied to different total masses m, then a = F / m. Rearranging, a is proportional to 1/m, giving a straight line that passes through the origin with slope F. Since the scenario uses a constant force, this behavior is exactly what the model predicts. Therefore this......Login to view full explanationLog in for full answers
We've collected over 50,000 authentic exam questions and detailed explanations from around the globe. Log in now and get instant access to the answers!
Similar Questions
Two forces A and B act on a 19.7kg particle. The larger force in magnitude is A. When both forces point due east the magnitude of the acceleration of the mass is 0.585m/s2. When A points due east and B points due west the mass accelerates at 0.477m/s2 due east. What is the magnitude of force A?
An object of mass M is accelerating because there is a force acting on it. What happens to the acceleration if I double the force?
What is the meaning of Σ in the equation ΣF = ma
What is Newton's second law?
More Practical Tools for Students Powered by AI Study Helper
Making Your Study Simpler
Join us and instantly unlock extensive past papers & exclusive solutions to get a head start on your studies!