Questions
Single choice
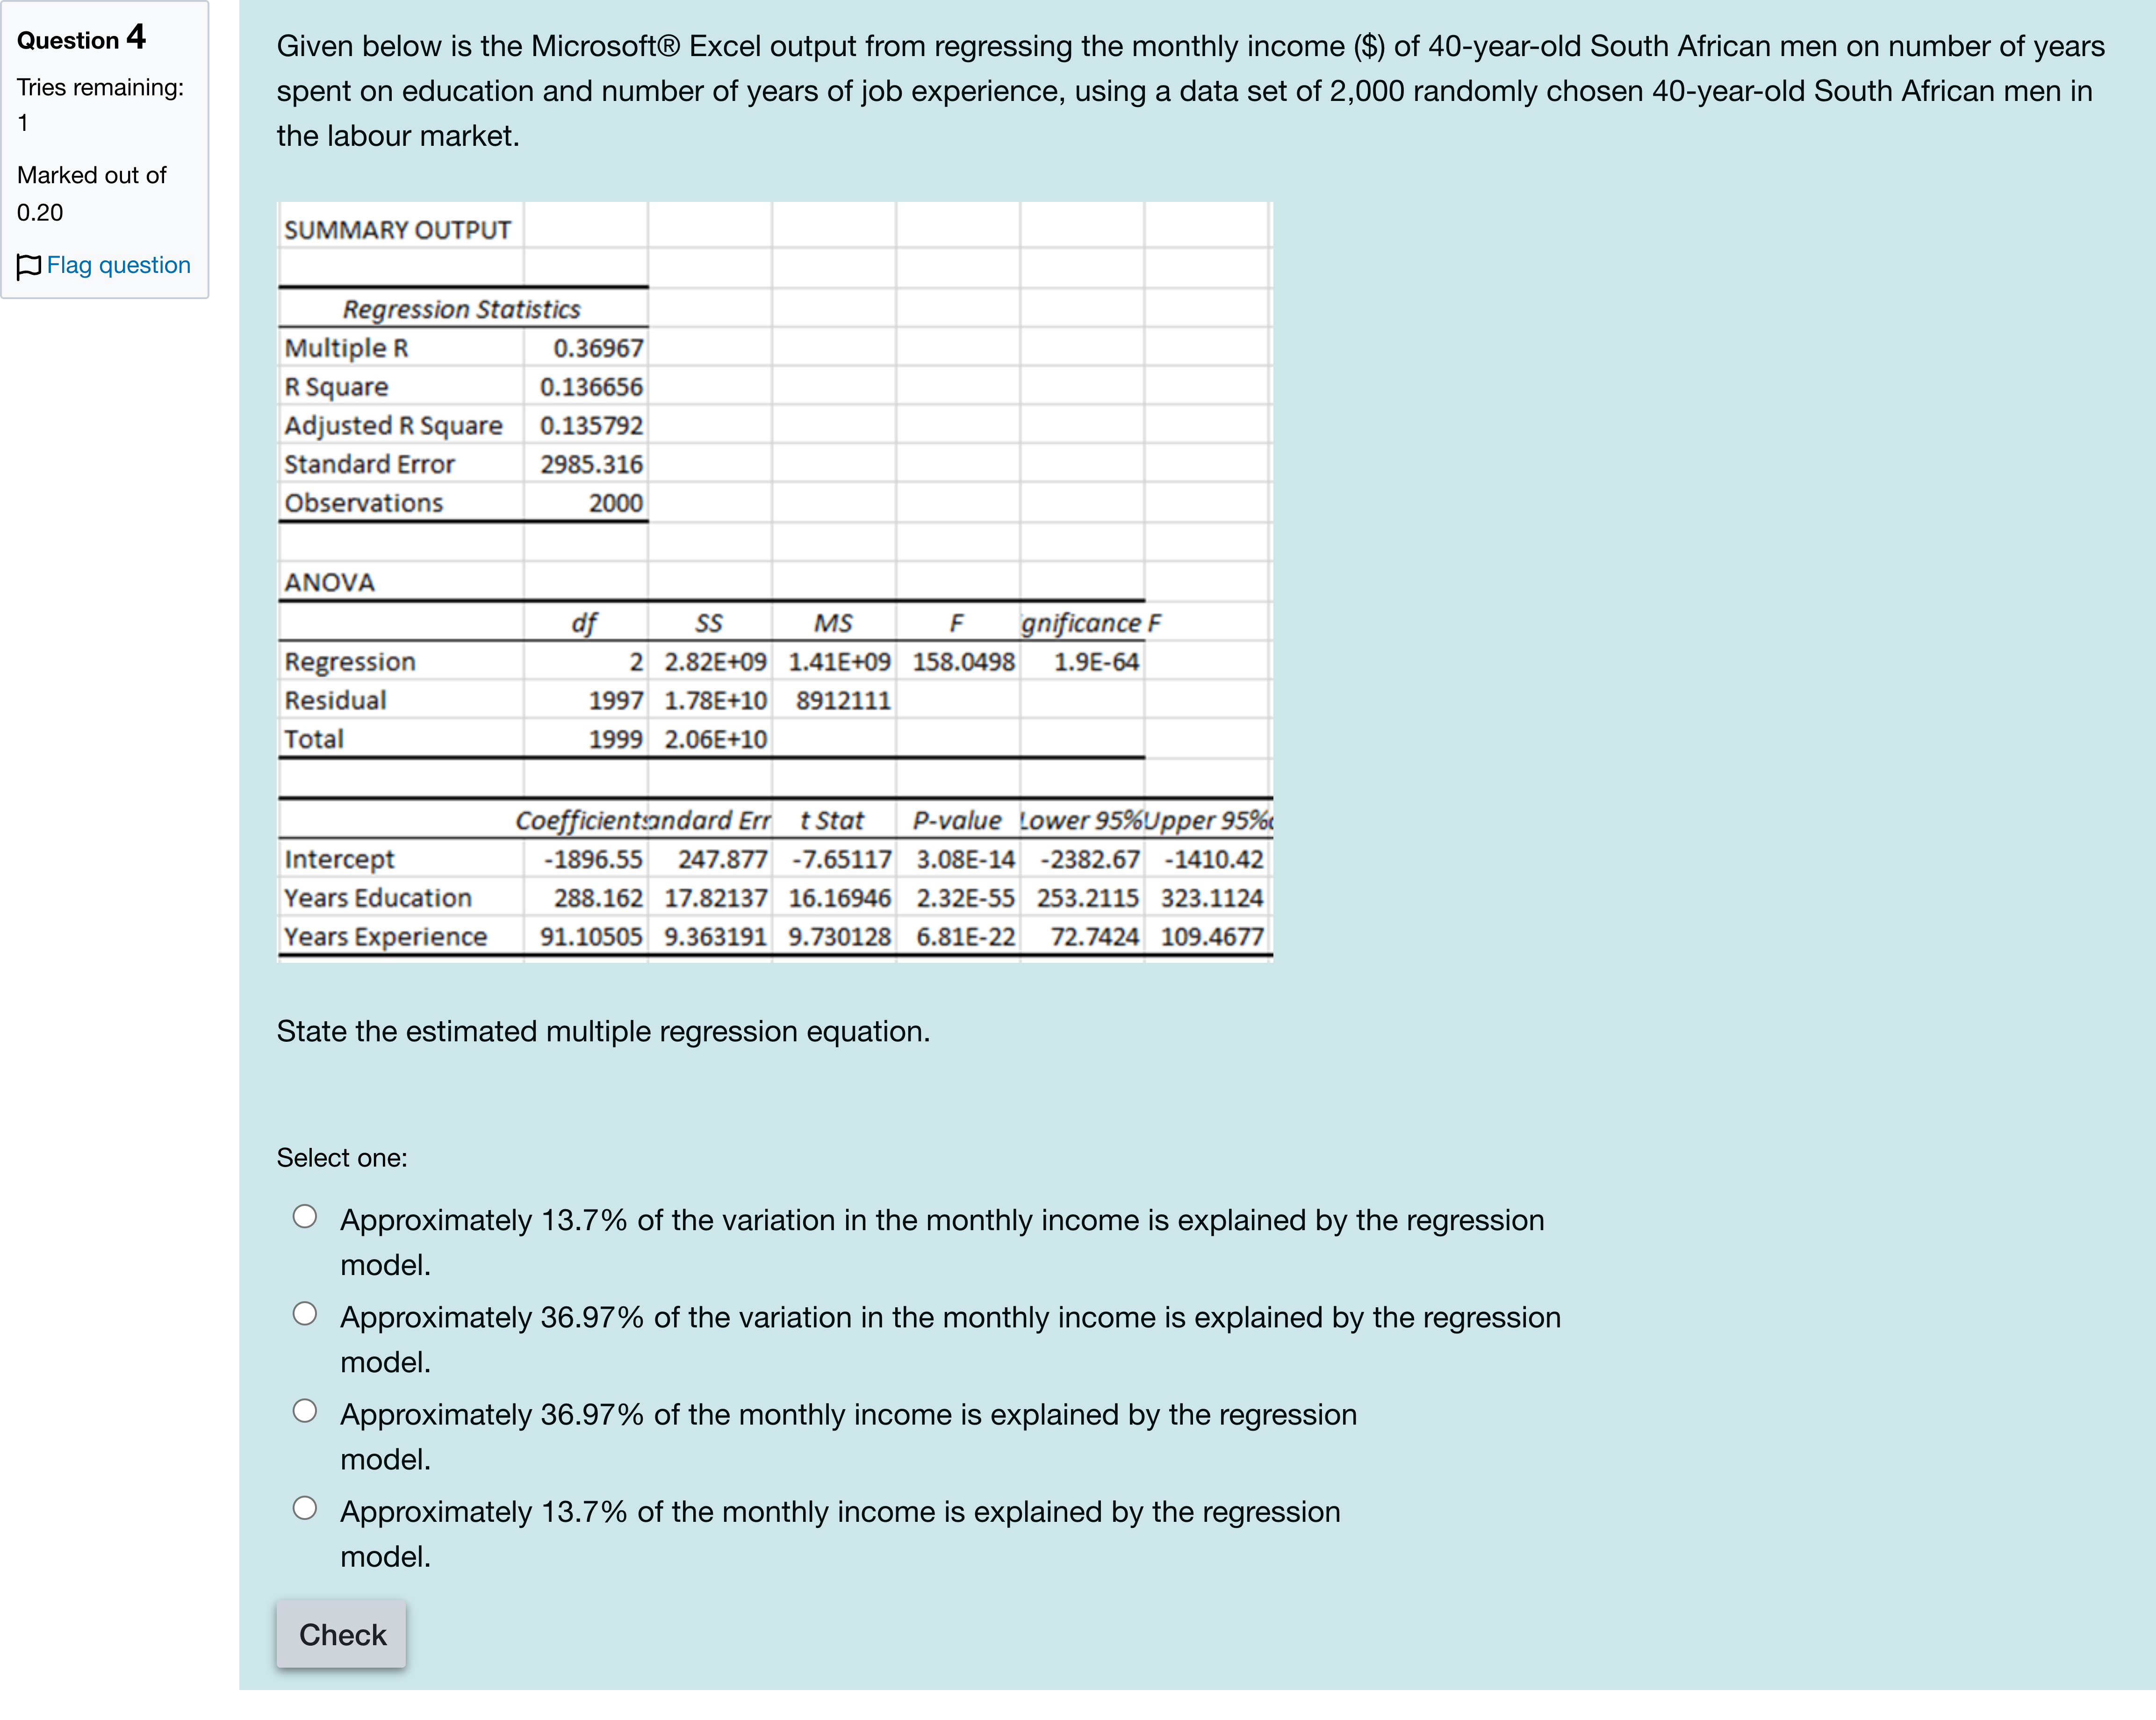
Given below is the Microsoft® Excel output from regressing the monthly income ($) of 40-year-old South African men on number of years spent on education and number of years of job experience, using a data set of 2,000 randomly chosen 40-year-old South African men in the labour market. State the estimated multiple regression equation.
Options
A.Approximately 13.7% of the variation in the monthly income is explained by the regression model.
B.Approximately 36.97% of the variation in the monthly income is explained by the regression model.
C.Approximately 36.97% of the monthly income is explained by the regression model.
D.Approximately 13.7% of the monthly income is explained by the regression model.
View Explanation
Verified Answer
Please login to view
Step-by-Step Analysis
To interpret the regression output, we need to examine the statistics that quantify how much of the variation in the dependent variable (monthly income) is explained by the model.
Option 1: 'Approximately 13.7% of the variation in the monthly income is explained by the regression model.' This matches the R-squared value shown as 0.13665 in the summary output, which indicates that about 13.7% of the variance in income is explained by the predictors (years......Login to view full explanationLog in for full answers
We've collected over 50,000 authentic exam questions and detailed explanations from around the globe. Log in now and get instant access to the answers!
Similar Questions
Below are the results of an association study conducted by Saha, Morris and Kang (2019):Adjusted R2 = 0.689 Which of the following is incorrect?
Question8 Including irrelevant regressors in multiple regression typically: Select one alternative: a) Increases variance of estimates b) Biases coefficients c) Reduces variance of estimates d) Leaves [math] unchanged ResetMaximum marks: 0.5 Flag question undefined
In the multiple regression model, [math: yi=β1+β2xi+β3zi+ui]y_i=\beta _1+\beta _2x_i +\beta _3z_i+u_i, which of the following leads to improved precision on the estimates [math: β^2]\hatβ_2, (that is, smaller [math: se(β^2|x,z)]se(\hat{\beta}_2|x,\,z)?[Fill in the blank]
What is the consequence of including irrelevant variables (those that have no direct effect on the dependent variable) in your regression model?[Fill in the blank]
More Practical Tools for Students Powered by AI Study Helper
Making Your Study Simpler
Join us and instantly unlock extensive past papers & exclusive solutions to get a head start on your studies!