Questions
MCD1110 - T3 - 2024 Week 12 Quiz
Single choice
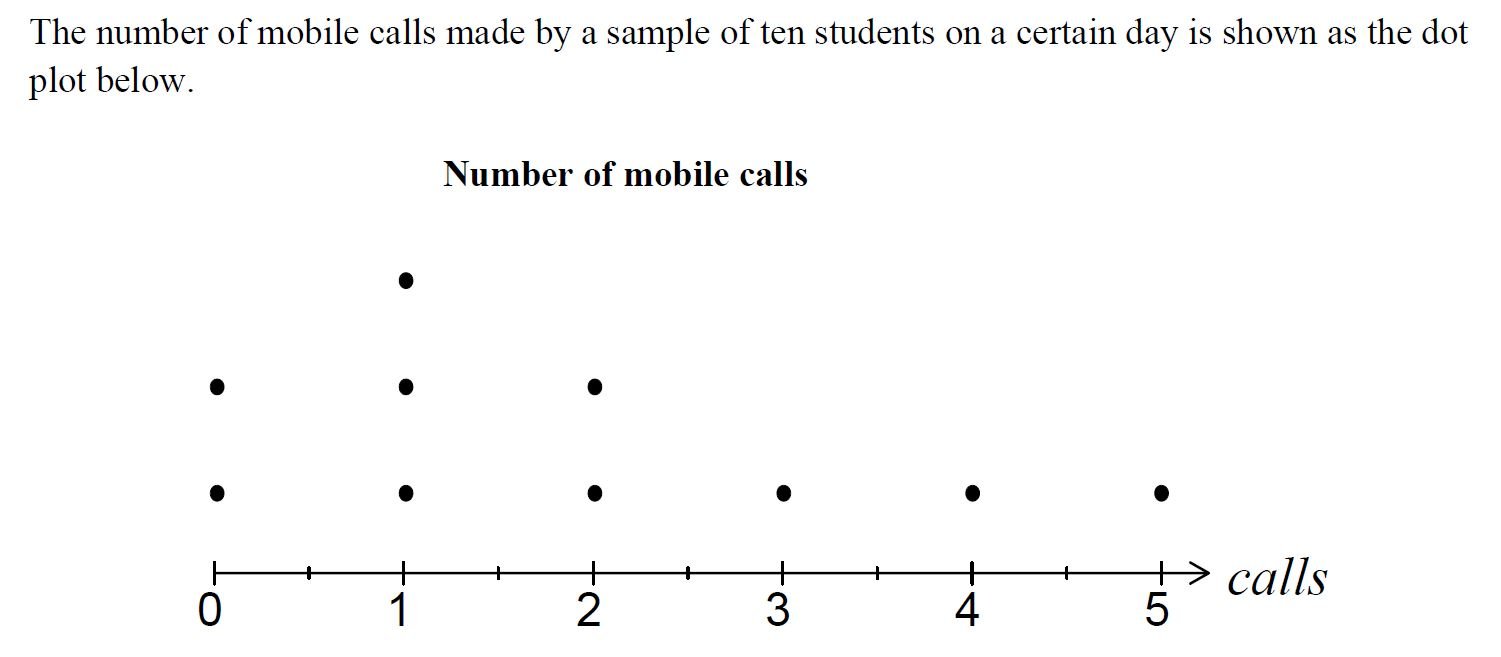
From the shape of the distribution we would expect:
Options
A.a. the mean number of calls to be the same as the median
B.b. the mean number of calls to be less than the median
C.c. the mean number of calls to be greater than the median
D.d. the mean number of calls to equal the interquartile range
View Explanation
Verified Answer
Please login to view
Step-by-Step Analysis
When looking at the dot plot, observe how the data pile up more heavily on the left side (lower numbers of calls) while a tail extends toward higher call counts. This pattern is characteristic of a right-skewed (positively skewed) distribution. In skewed distributions, the mean is sensitive to extreme values in the tail, so it tends to be pulled in the direction of the ......Login to view full explanationLog in for full answers
We've collected over 50,000 authentic exam questions and detailed explanations from around the globe. Log in now and get instant access to the answers!
Similar Questions
If a distribution is extremely skewed to the right, where will the mean appears in relation to the median?
Consider the heights of a group of students: 165, 171, 173, 180, 180, 181 Suppose that one of the "180"s was accidentally recorded as "18". Would the mean or median be more affected by the change?
In a consumer society, many adults channel creativity into buying things
Economic stress and unpredictable times have resulted in a booming industry for self-help products
More Practical Tools for Students Powered by AI Study Helper
Making Your Study Simpler
Join us and instantly unlock extensive past papers & exclusive solutions to get a head start on your studies!