Questions
Single choice
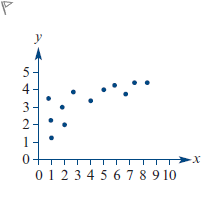
The association between two variables y and x, asshown in the scatterplot above, is non-linear. In an attempt totransform the relationship to linearity, a student wouldbe advised to:
Options
A.a. use a y2 transformation
B.b. leave out the first four points
C.c. use a log y transformation
D.d. use a 1/y transformation
View Explanation
Verified Answer
Please login to view
Step-by-Step Analysis
The scenario describes a non-linear association between y and x as shown in the scatterplot, and the goal is to achieve linearity through a transformation.
Option a: 'use a y^2 transformation'—This is a possible transformation in some contexts, but it would square the dependent variable and is not ......Login to view full explanationLog in for full answers
We've collected over 50,000 authentic exam questions and detailed explanations from around the globe. Log in now and get instant access to the answers!
Similar Questions
The following data were collected for two related variables x and y. A scatterplot indicates a non-linear association. The data is linearised using a logx transformation and a least squares line is then fitted. The equation of this line isclosest to:
The association between two variables y and x, as shown in the scatterplot above, is non-linear. Which of the following transformations is most likely to linearise the relationship?
The following data were collected for two related variables x and y. A scatterplot indicates a non-linear association. The data is linearised using a logx transformation and a least squares line is then fitted. The equation of this line isclosest to:
Which transformation is commonly used to reduce right-skewed distributions?
More Practical Tools for Students Powered by AI Study Helper
Making Your Study Simpler
Join us and instantly unlock extensive past papers & exclusive solutions to get a head start on your studies!