Questions
Single choice
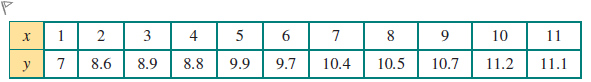
The following data were collected for two related variables x and y. A scatterplot indicates a non-linear association. The data is linearised using a logx transformation and a least squares line is then fitted. The equation of this line isclosest to:
Options
A.a. y = 7.04 + 3.86 log x
B.b. y = −1.71 + 0.25 log x
C.c. y = 0.37 + 7.52 log x
D.d. y = 7.52 + 0.37 log x
View Explanation
Verified Answer
Please login to view
Step-by-Step Analysis
First, consider the transformation described: a logx transformation is applied to x, and then a least-squares line is fitted to y versus log x. This means the model is of the form y = a + b log(x), where log is typically base 10 in many introductory analyses unless stated otherwise.
Option a: y = 7.04 + 3.86 log x
- This has an intercept around 7.0 and a positive slope close to 3.9, which matches......Login to view full explanationLog in for full answers
We've collected over 50,000 authentic exam questions and detailed explanations from around the globe. Log in now and get instant access to the answers!
Similar Questions
Consider the following estimated regression model [math: ln(yi)^=0.034−0.023xi]\widehat {\ln (y_i)}=0.034-0.023x_i where [math: ln(.)]\ln (.) denotes the natural log. Which of the following is a correct interpretation?[Fill in the blank]
An exponential model with a quarterly data forecasting equation is log( ˆ Y i)=2.0886+0.0016Xi−0.0528Q1−0.0389Q2−0.0449Q3 Where Xi represents the coded quarter, Qi is a dummy variable for quarters, Qi=1 if it is ith quarter. What is the prediction when Xi=27, and it is the fourth quarter?
The following data were collected for two related variables x and y. A scatterplot indicates a non-linear association. The data is linearised using a logx transformation and a least squares line is then fitted. The equation of this line isclosest to:
Read Example 7.9 on page 233 carefully. Consider the following sample regression function: log ( 𝑤 𝑎 𝑔 𝑒 ) ^ = 𝛽 ^ 0 + .2 𝑐 𝑜 𝑚 𝑝 𝑤 𝑜 𝑟 𝑘 + .05 𝑐 𝑜 𝑚 𝑝 ℎ 𝑜 𝑚 𝑒 + .03 𝑐 𝑜 𝑚 𝑝 𝑤 𝑜 𝑟 𝑘 ⋅ 𝑐 𝑜 𝑚 𝑝 ℎ 𝑜 𝑚 𝑒 + 𝑜 𝑡 ℎ 𝑒 𝑟 𝑓 𝑎 𝑐 𝑡 𝑜 𝑟 𝑠 ( .01 ) ( .02 ) ( .005 ) where the variables wage, compwork, and comphome are defined respectively as hourly wage, = 1 if an individual uses a computer at work, and = 1 if an individual uses a computer at home. Which of the following statements is correct?
More Practical Tools for Students Powered by AI Study Helper
Making Your Study Simpler
Join us and instantly unlock extensive past papers & exclusive solutions to get a head start on your studies!