Questions
ECON 2002.01 AU2025 (21333) Final Exam- Requires Respondus LockDown Browser
Single choice
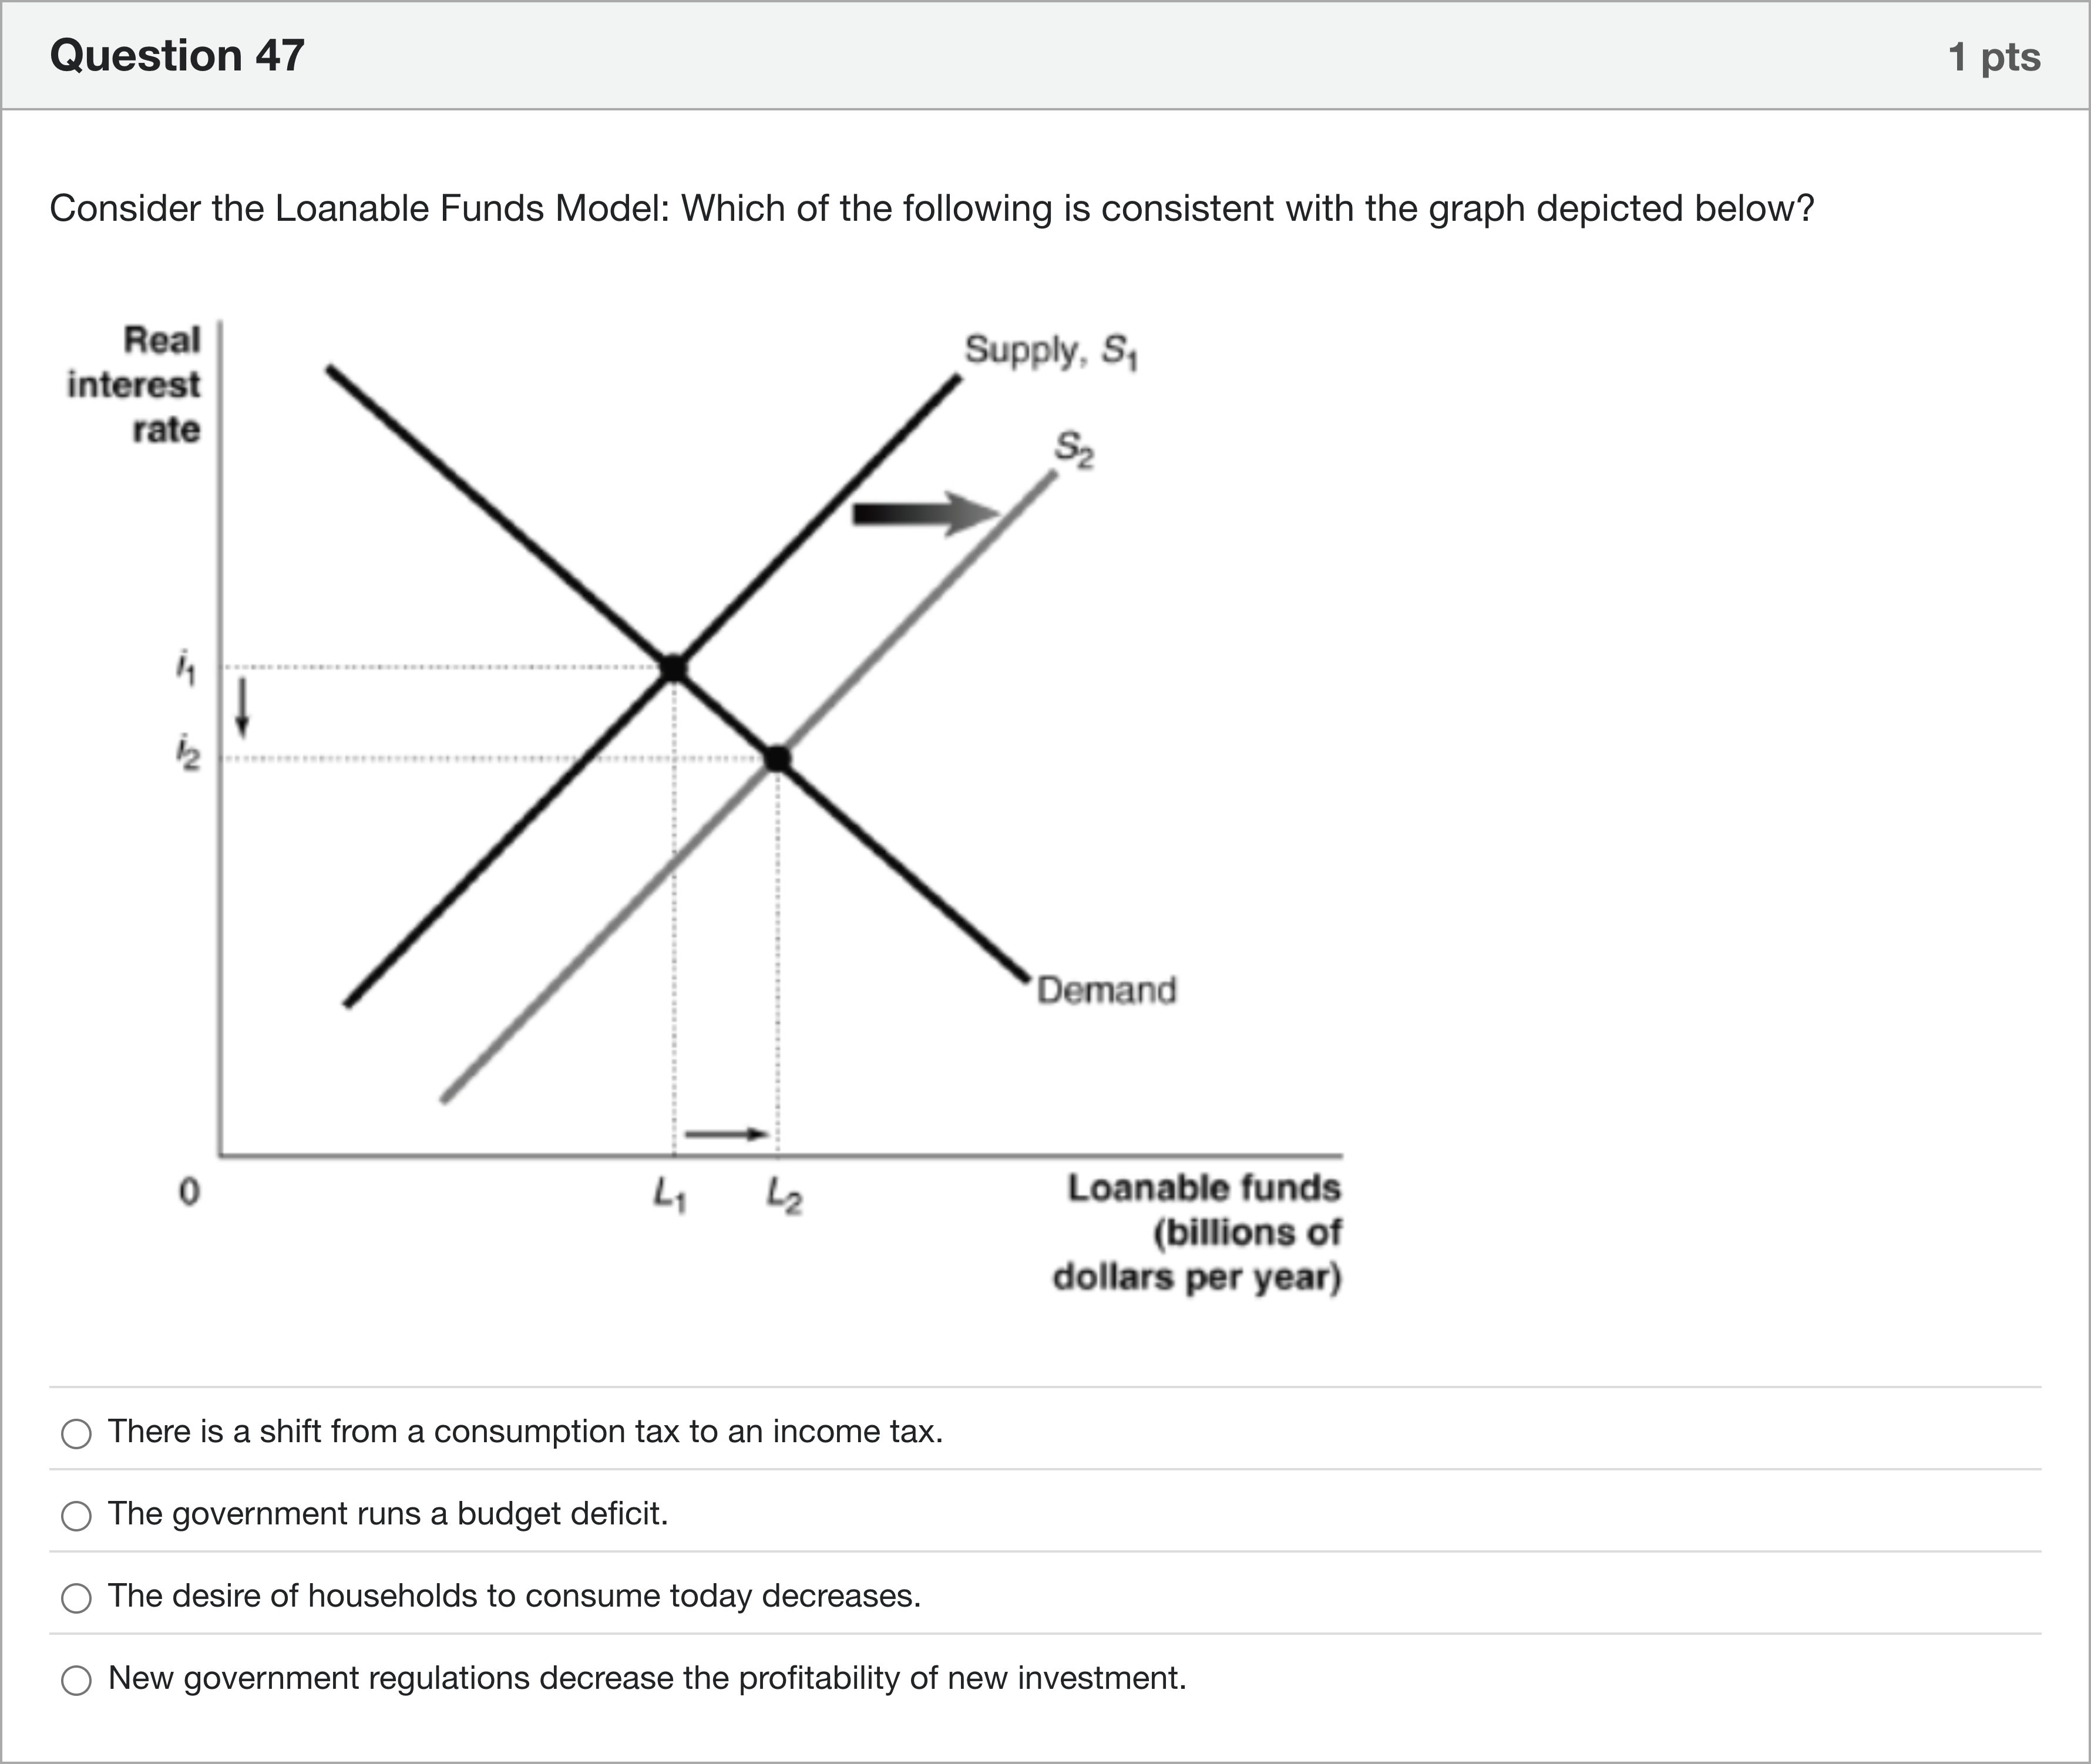
Consider the Loanable Funds Model: Which of the following is consistent with the graph depicted below?
Options
A.There is a shift from a consumption tax to an income tax.
B.The government runs a budget deficit.
C.The desire of households to consume today decreases.
D.New government regulations decrease the profitability of new investment.
View Explanation
Verified Answer
Please login to view
Step-by-Step Analysis
Begin by identifying what the graph is showing: in the Loanable Funds Model, the horizontal axis measures loanable funds and the vertical axis shows real interest rate. The graph depicts a shift of the supply of loanable funds from S1 to S2 (an outward/rightward shift) with the demand curve remaining in place, and the new equilibrium occurs at a higher quantity of funds (L2) and a lower interest rate (i2). This pat......Login to view full explanationLog in for full answers
We've collected over 50,000 authentic exam questions and detailed explanations from around the globe. Log in now and get instant access to the answers!
Similar Questions
The graph above shows hypothetical supply and demand functions for loanable funds. Suppose that FDIC increases the amounts of insured bank deposits and as a result the credit risk decreases for depositors (households and firms that deposit money in commercial banks). This causes one of the functions to shift by $40 million. As a result, the new equilibrium real interest rate equals X percent. What is X? Note: Ex-ante real interest rate is the same thing as real interest rate.
The supply of loanable funds curve is _____ sloping because _____ respond to lower interest rates by _____ their quantity supplied of loanable funds.
A decrease in household savings due to higher consumer spending will generally cause a ___________ the ___________for loanable funds.[Fill in the blank]
Question2 According to the loanable funds approach, an increase in inflation expectations will have the following immediate effect: Shift both the demand and supply curves to the right Only the supply curve shifts to the left, while the demand curve remains unchanged. Shift both the demand and supply curves to the left Shift the demand curve to the right and the supply curve to the left Only the demand curve shifts to the right, while the supply curve remains unchanged. Shift the demand curve to the left and the supply curve to the right ResetMaximum marks: 0.59 Flag question undefined
More Practical Tools for Students Powered by AI Study Helper
Making Your Study Simpler
Join us and instantly unlock extensive past papers & exclusive solutions to get a head start on your studies!