Questions
ECON 2002.01 AU2025 (21333) Midterm Exam 2- Requires Respondus LockDown Browser
Single choice
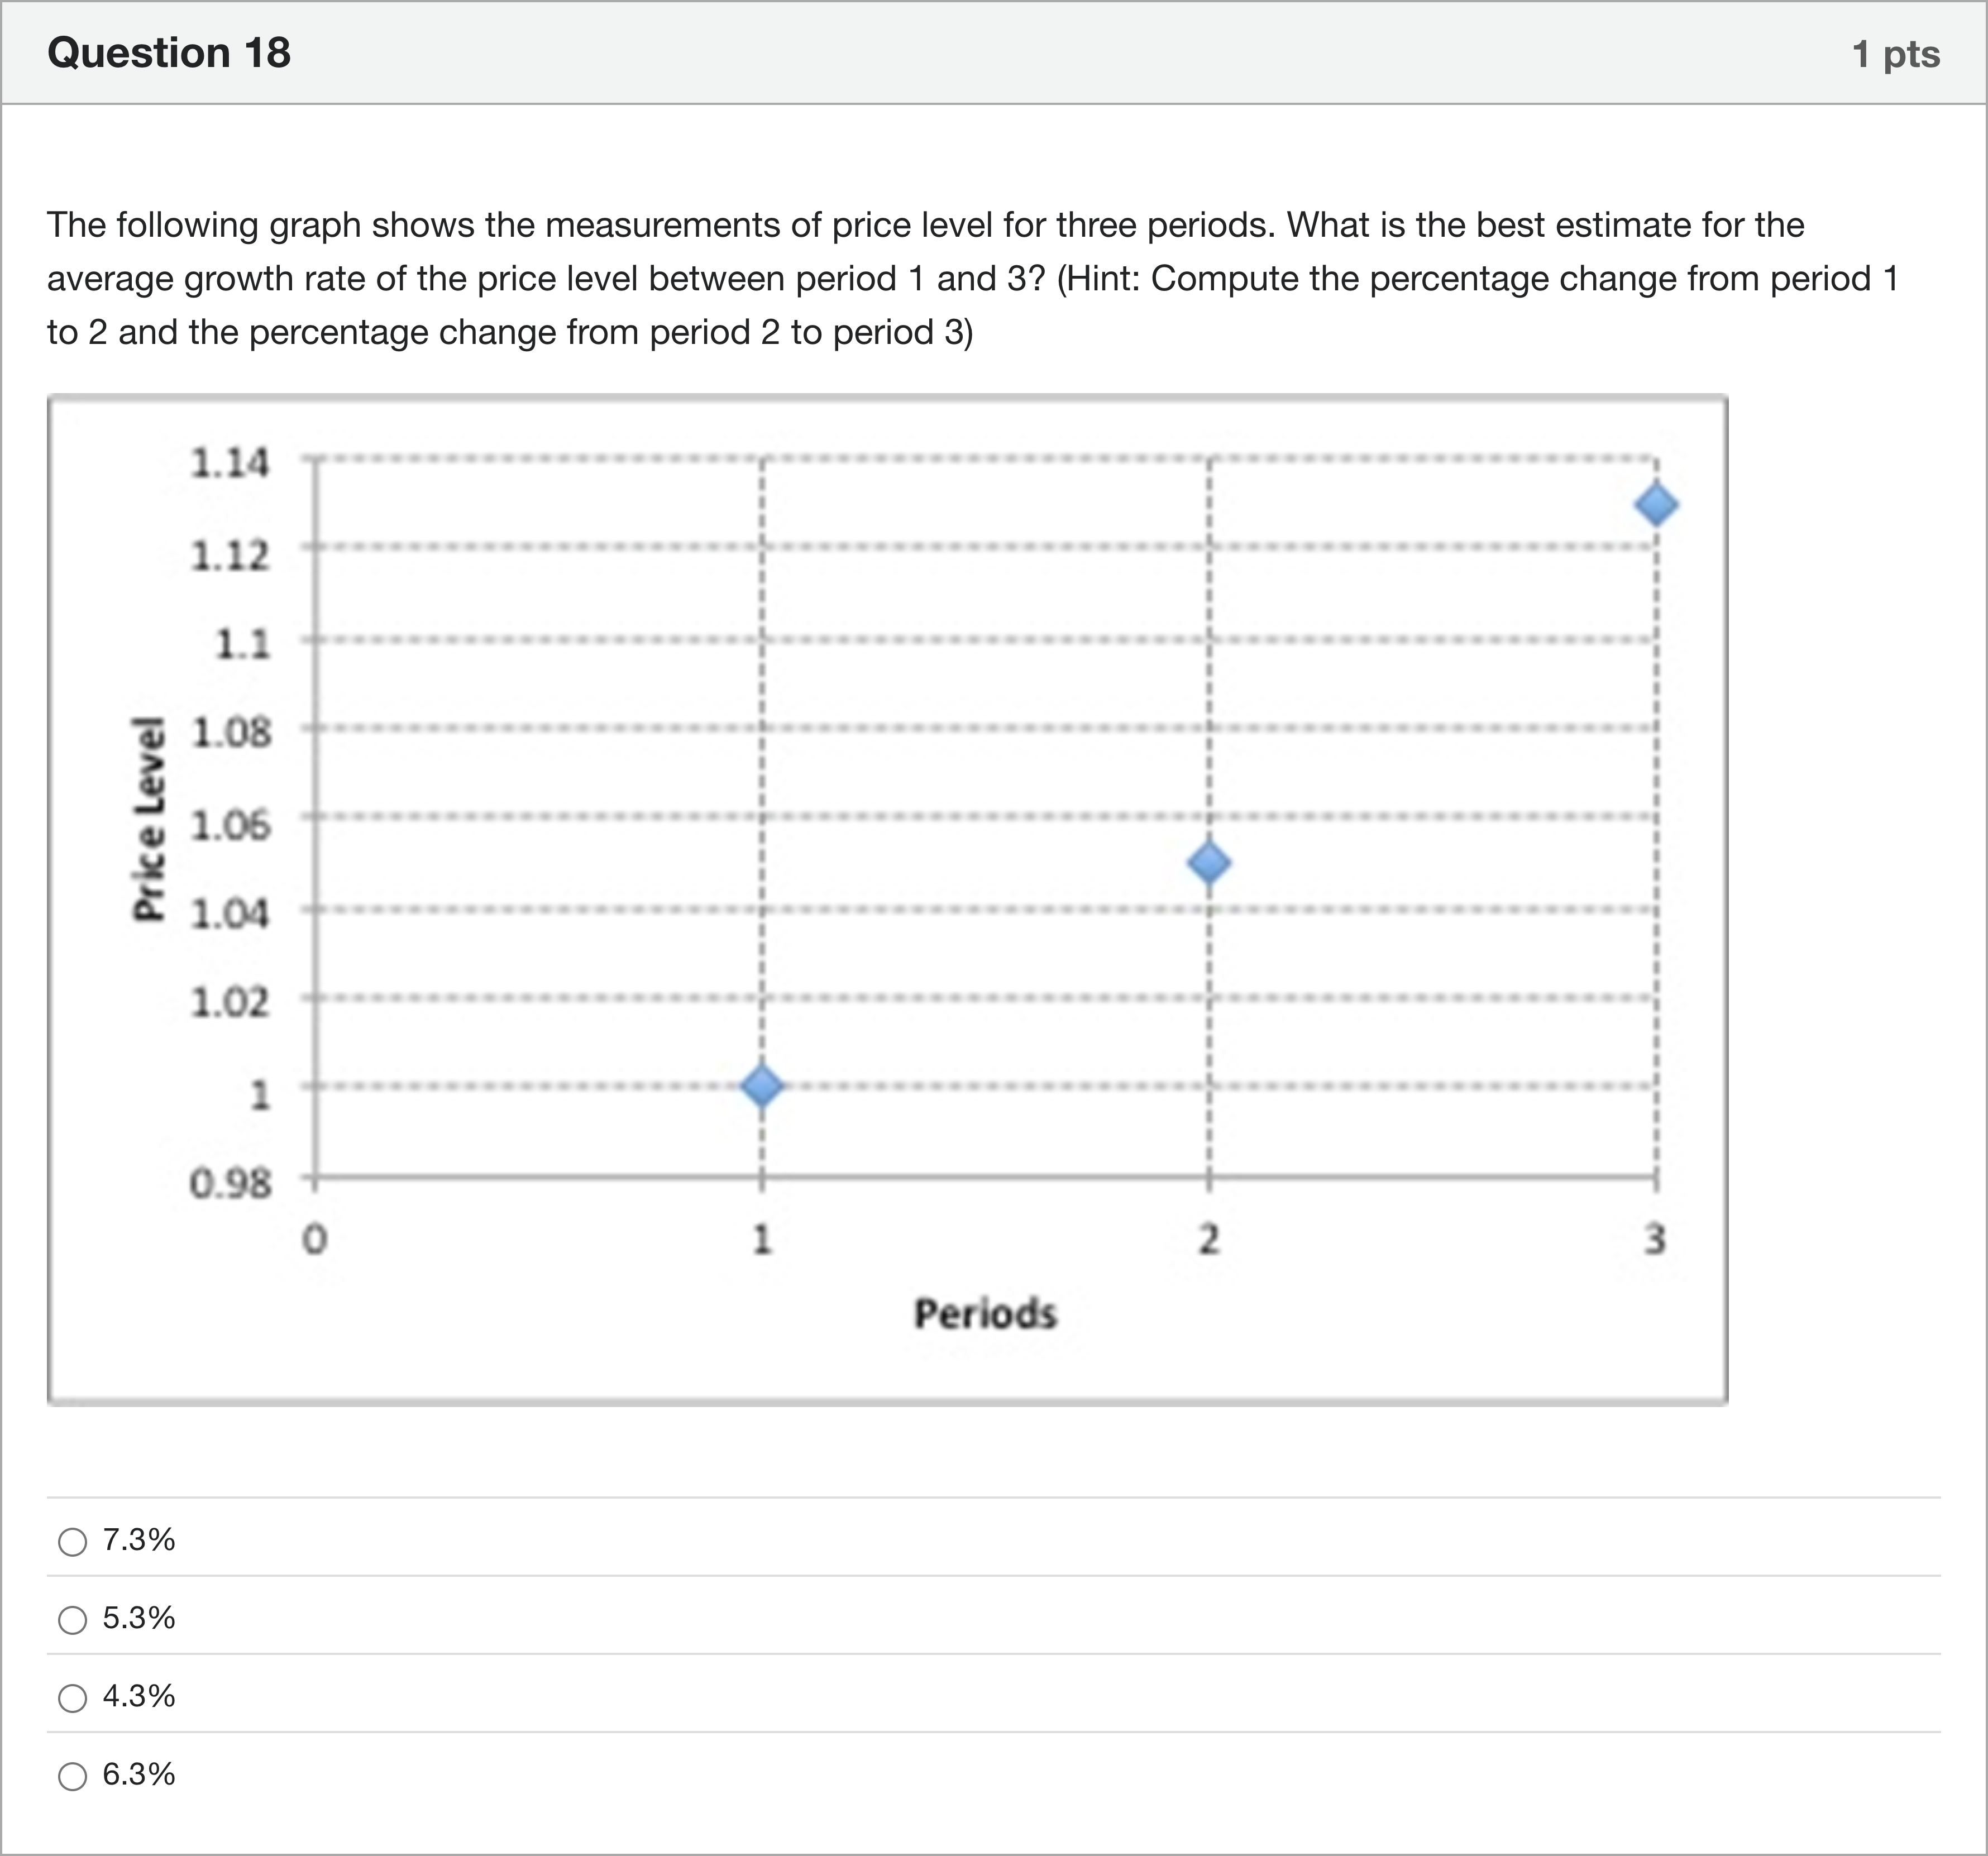
The following graph shows the measurements of price level for three periods. What is the best estimate for the average growth rate of the price level between period 1 and 3? (Hint: Compute the percentage change from period 1 to 2 and the percentage change from period 2 to period 3)
Options
A.7.3%
B.5.3%
C.4.3%
D.6.3%
View Explanation
Verified Answer
Please login to view
Step-by-Step Analysis
The question asks for the best estimate of the average growth rate in the price level from period 1 to period 3, using the two intermediate changes.
First, identify the price levels from the graph: P1 is 1.00, P2 is about ......Login to view full explanationLog in for full answers
We've collected over 50,000 authentic exam questions and detailed explanations from around the globe. Log in now and get instant access to the answers!
Similar Questions
If the Consumer Price Index (CPI) falls from 100 to 98 between two consecutive years, this implies that prices fell by 2% between those two years.
Table 24-1 The following table pertains to Cheeseland, an economy in which the typical consumer's basket consists of 15 bushels of apples and 8 bushels of almond . Year Price of Apples (Dollars per bushel) Price of Almond (Dollars per bushel) Year 1 12 6 Year 2 9 11 Refer to Table 24-1. If Year 1 is the base year, then the inflation rate in Year 2 was
If Year 1 is the base year and Year 2 is the following year, then the inflation rate in Year 2 equals
Table 23-4 The country of Caspir produces only cereal and milk. Quantities and prices of these goods for the last several years are shown in the following table. The base year is 2015. Year Cereal Milk Price (Dollars per box) Quantity (Boxes of cereal) Price (Dollars per gallon) Quantity (Gallons) 2015 4.00 100 1.50 180 2016 4.00 120 2.00 200 2017 5.00 150 2.50 200 2018 6.00 180 3.50 240 Refer to Table 23-4. This country's inflation rate from 2016 to 2017 was
More Practical Tools for Students Powered by AI Study Helper
Making Your Study Simpler
Join us and instantly unlock extensive past papers & exclusive solutions to get a head start on your studies!