Questions
MEDS2012 (ND) Module 2 Quiz Wednesday AM
Single choice
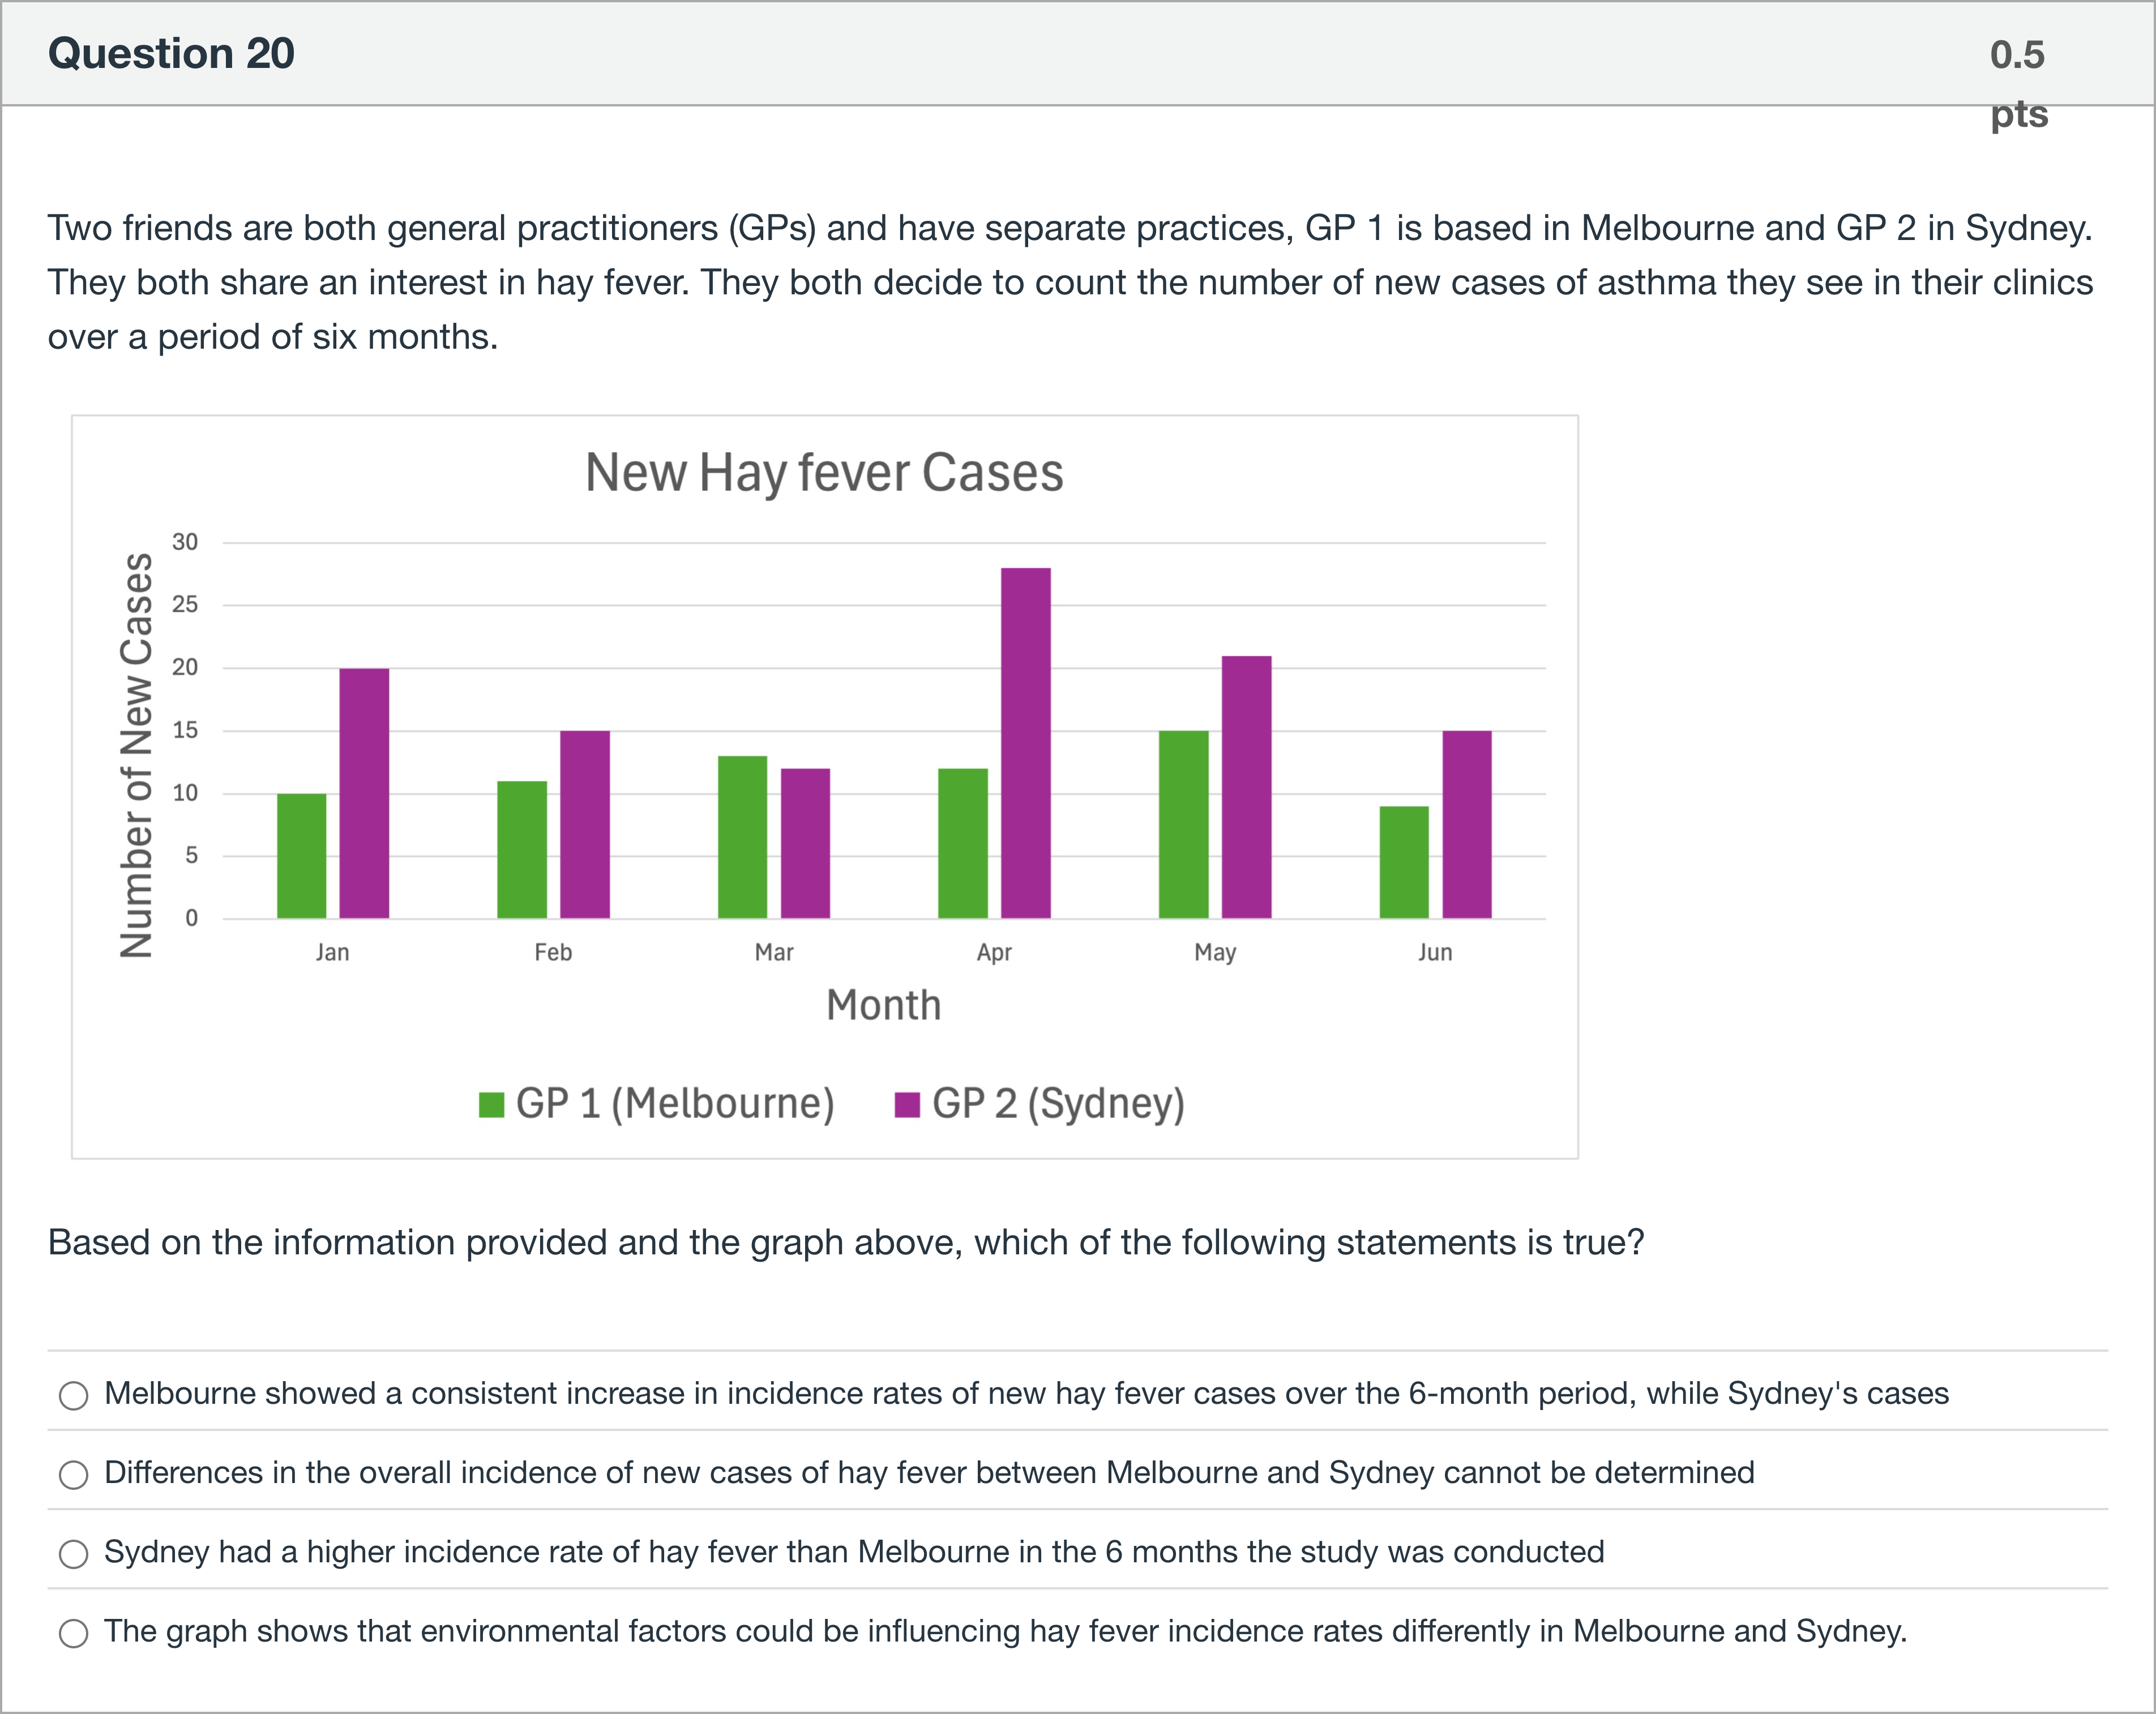
Two friends are both general practitioners (GPs) and have separate practices, GP 1 is based in Melbourne and GP 2 in Sydney. They both share an interest in hay fever. They both decide to count the number of new cases of asthma they see in their clinics over a period of six months. Based on the information provided and the graph above, which of the following statements is true?
Options
A.Melbourne showed a consistent increase in incidence rates of new hay fever cases over the 6-month period, while Sydney's cases fluctuated.
B.Differences in the overall incidence of new cases of hay fever between Melbourne and Sydney cannot be determined
C.Sydney had a higher incidence rate of hay fever than Melbourne in the 6 months the study was conducted
D.The graph shows that environmental factors could be influencing hay fever incidence rates differently in Melbourne and Sydney.
View Explanation
Verified Answer
Please login to view
Step-by-Step Analysis
Interpreting the graph and the accompanying description requires evaluating each statement against what the data show about Melbourne (green) and Sydney (purple).
Option 1: Melbourne showed a consistent increase in incidence rates of new hay fever cases over the 6-month period, while Sydney's cases fluctuated. This is not accurate. Melbourne starts around 8 in January, rises to about 10 in February, increases to ~12 in March, stays near 12 in April, rises to ~15 in May, then d......Login to view full explanationLog in for full answers
We've collected over 50,000 authentic exam questions and detailed explanations from around the globe. Log in now and get instant access to the answers!
Similar Questions
In a consumer society, many adults channel creativity into buying things
Economic stress and unpredictable times have resulted in a booming industry for self-help products
People born without creativity never can develop it
A product has a selling price of $20, a contribution margin ratio of 40% and fixed cost of $120,000. To make a profit of $30,000. The number of units that must be sold is: Type the number without $ and a comma. Eg: 20000
More Practical Tools for Students Powered by AI Study Helper
Making Your Study Simpler
Join us and instantly unlock extensive past papers & exclusive solutions to get a head start on your studies!