Questions
APBIO141-031 with labs Unit 4 Test
Single choice
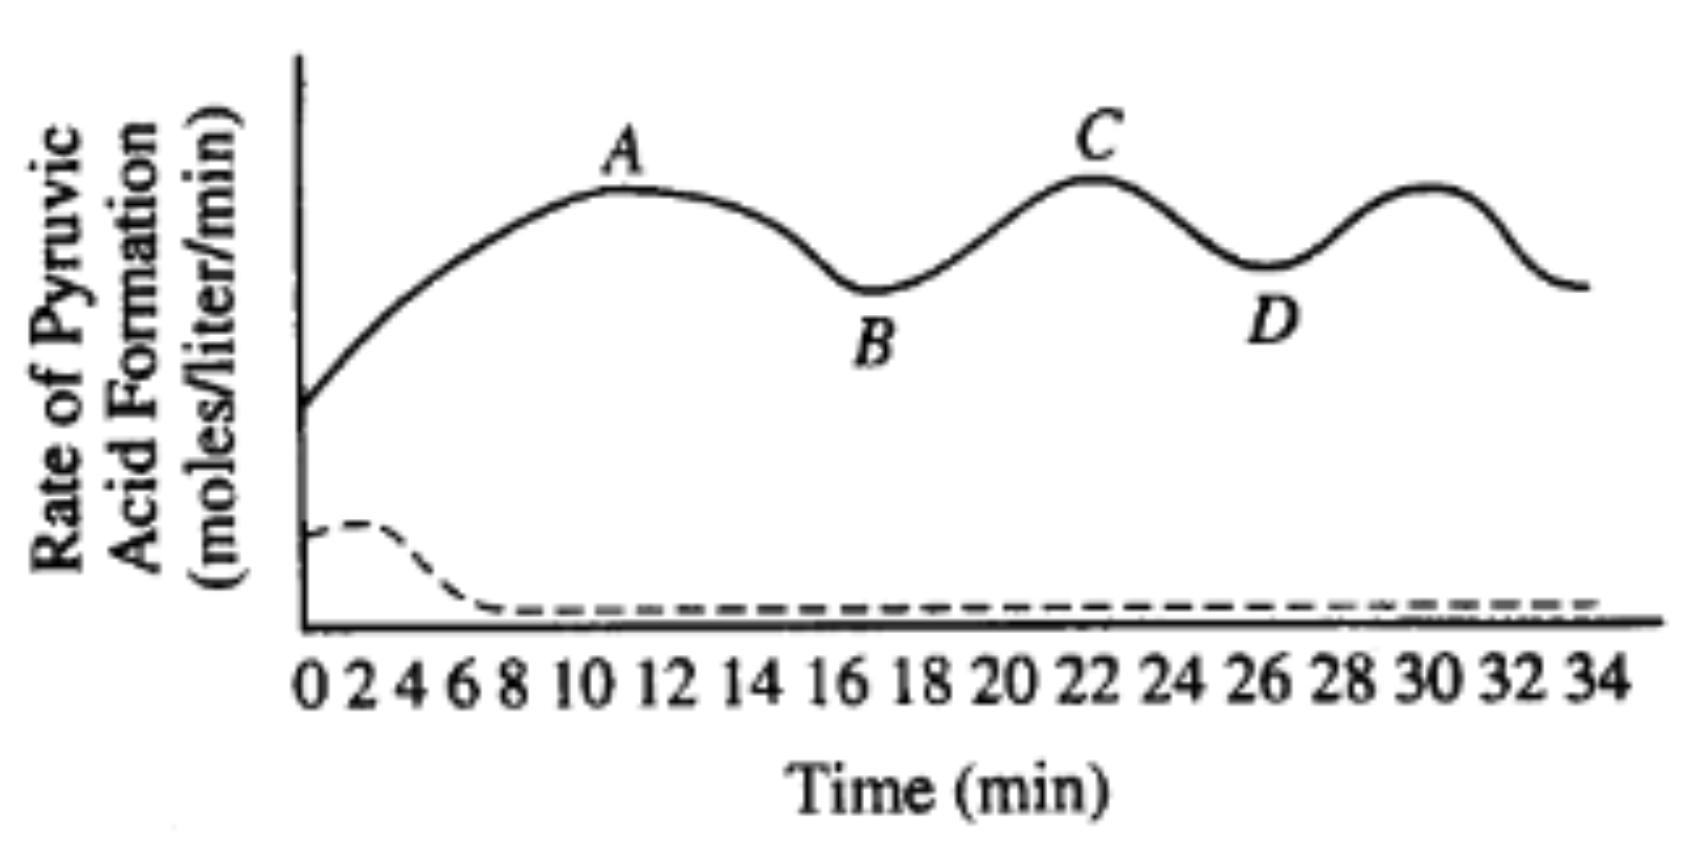
A tissue culture of vertebrate muscle was provided with a constant excess supply of glucose under anaerobic conditions starting at time zero and the amounts of pyruvic acid and ATP produced were measured. The solid line in the graph above represents the pyruvic acid produced in moles per liter per minute. ATP levels were also found to be highest at points A and C, lowest at B and D. A second culture was set up under the same conditions, except that substance X was added, and the results are indicated by the dotted line. The rate of pyruvic acid formation fluctuates because
Options
A.coenzymes have begun to function
B.all enzymes have been used up
C.the reaction is affected by negative feedback
D.all glucose has reacted
E.the reaction is accelerated by positive feedback
View Explanation
Verified Answer
Please login to view
Step-by-Step Analysis
In this physiology/biochemistry scenario, we’re looking at why the rate of pyruvic acid formation would oscillate under anaerobic conditions with excess glucose.
Option 1: 'coenzymes have begun to function' This is not a likely cause of the observed fluctuations. Coenzymes typically participate to enable enzyme reactions, but their function doesn’t inherently cause periodic rises and falls in flux unless their levels are limiting and change over time i......Login to view full explanationLog in for full answers
We've collected over 50,000 authentic exam questions and detailed explanations from around the globe. Log in now and get instant access to the answers!
Similar Questions
Question at position 19 Catabolic pathways that break down substances into more usable units are usually regulated in response to the levels of enzymes in the pathway.end products of the pathway.levels of the molecule that is to be broken down.other metabolites that are limiting.Clear my selection
Quite often the synthesis of an enzyme at the beginning of a biochemical pathway is
A tissue culture of vertebrate muscle was provided with a constant excess supply of glucose under anaerobic conditions starting at time zero and the amounts of pyruvic acid and ATP produced were measured. The solid line in the graph above represents the pyruvic acid produced in moles per liter per minute. ATP levels were also found to be highest at points A and C, lowest at B and D. A second culture was set up under the same conditions, except that substance X was added, and the results are indicated by the dotted line. The rate of pyruvic acid formation fluctuates because
Question4 Some enzymes show feedback inhibition where products formed are their own inhibitors. In the biochemical pathway shown below, which enzyme is the best one to be inhibited by product A from the pathway, so it is shut down in the most energy efficient manner? Input your answer as a single whole number representing the enzyme number that you choose (i.e. input either 1, 2, 3 or 4). Answer: [input] . Maximum marks: 1 Flag question undefined
More Practical Tools for Students Powered by AI Study Helper
Making Your Study Simpler
Join us and instantly unlock extensive past papers & exclusive solutions to get a head start on your studies!